Study Area and Background
Tse’khene
The Parsnip River watershed is located within the south-eastern portion of the 108,000 km2 traditional territory of the Tse’khene from the McLeod Lake Indian Band. The Tse’khene “People of the Rocks” are a south westerly extension of the Athabascan speaking people of northern Canada. They were nomadic hunters whose language belongs to the Beaver-Sarcee-Tse’khene branch of Athapaskan (“History - Who We Are” n.d.). Extensive work is underway to preserve the language with resources such as First Voices available online and in app form for iphone and ipad devices (First People Cultural Council 2022; Language and Council 2022).
The continental divide separates watersheds flowing north into the Arctic Ocean via the Mackenzie River and south and west into the Pacific Ocean via the Fraser River (Figure 1). The Parsnip River is a 6th order stream with a watershed that drains an area of 5597km2. The mainstem of the river flows within the Rocky Mountain Trench in a north direction into Williston Reservoir starting from the continental divide adjacent to Arctic Lakes. Major tributaries include the Misinchinka, Colbourne, Reynolds, Anzac, Table, Hominka and Missinka sub-basins which drain the western slopes of the Hart Ranges of the Rocky Mountains. The Parsnip River has a mean annual discharge of 147.3 m3/s with flow patterns typical of high elevation watersheds on the west side of the northern Rocky Mountains which receive large amounts of precipitation as snow leading to peak levels of discharge during snowmelt, typically from May to July (Figures 2 - 3).
Construction of the 183 m high and 2134 m long W.A.C. Bennett Dam was completed in 1967 at Hudson’s Hope, BC, creating the Williston Reservoir (Hirst 1991). Filling of the 375km2 reservoir was complete in 1972 and flooded a substantial portion of the Parsnip River and major tributary valleys forming what is now known as the Peace and Parsnip reaches. The replacement of riverine habitat with an inundated reservoir environment resulted in profound changes to the ecology, resource use and human settlement patterns in these systems (Hagen et al. 2015a; Pearce 2019; Stamford, Hagen, and Williamson 2017a). Prior to the filling of the reservoir, the Pack River, into which McLeod Lake flows, was a major tributary to the Parsnip River. The Pack River currently enters the Williston Reservoir directly as the historic location of the confluence of the two rivers lies within the reservoir’s footprint.
knitr::include_graphics("fig/overview.jpg")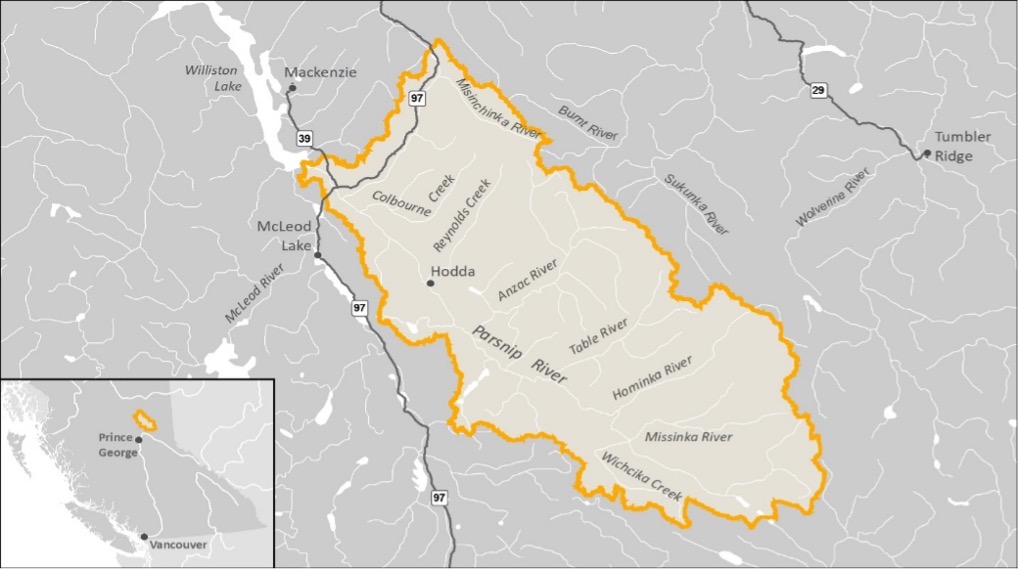
Figure 1: Overview map of study area
# knitr::include_graphics("fig/hydrology1-1.png")  ##left this here in case we want to go back to having this build from scratch.

# img <- png::readPNG("fig/hydrology1.png")
# grid::grid.raster(img)

knitr::include_graphics("fig/hydrograph_pdf_07EE007.png")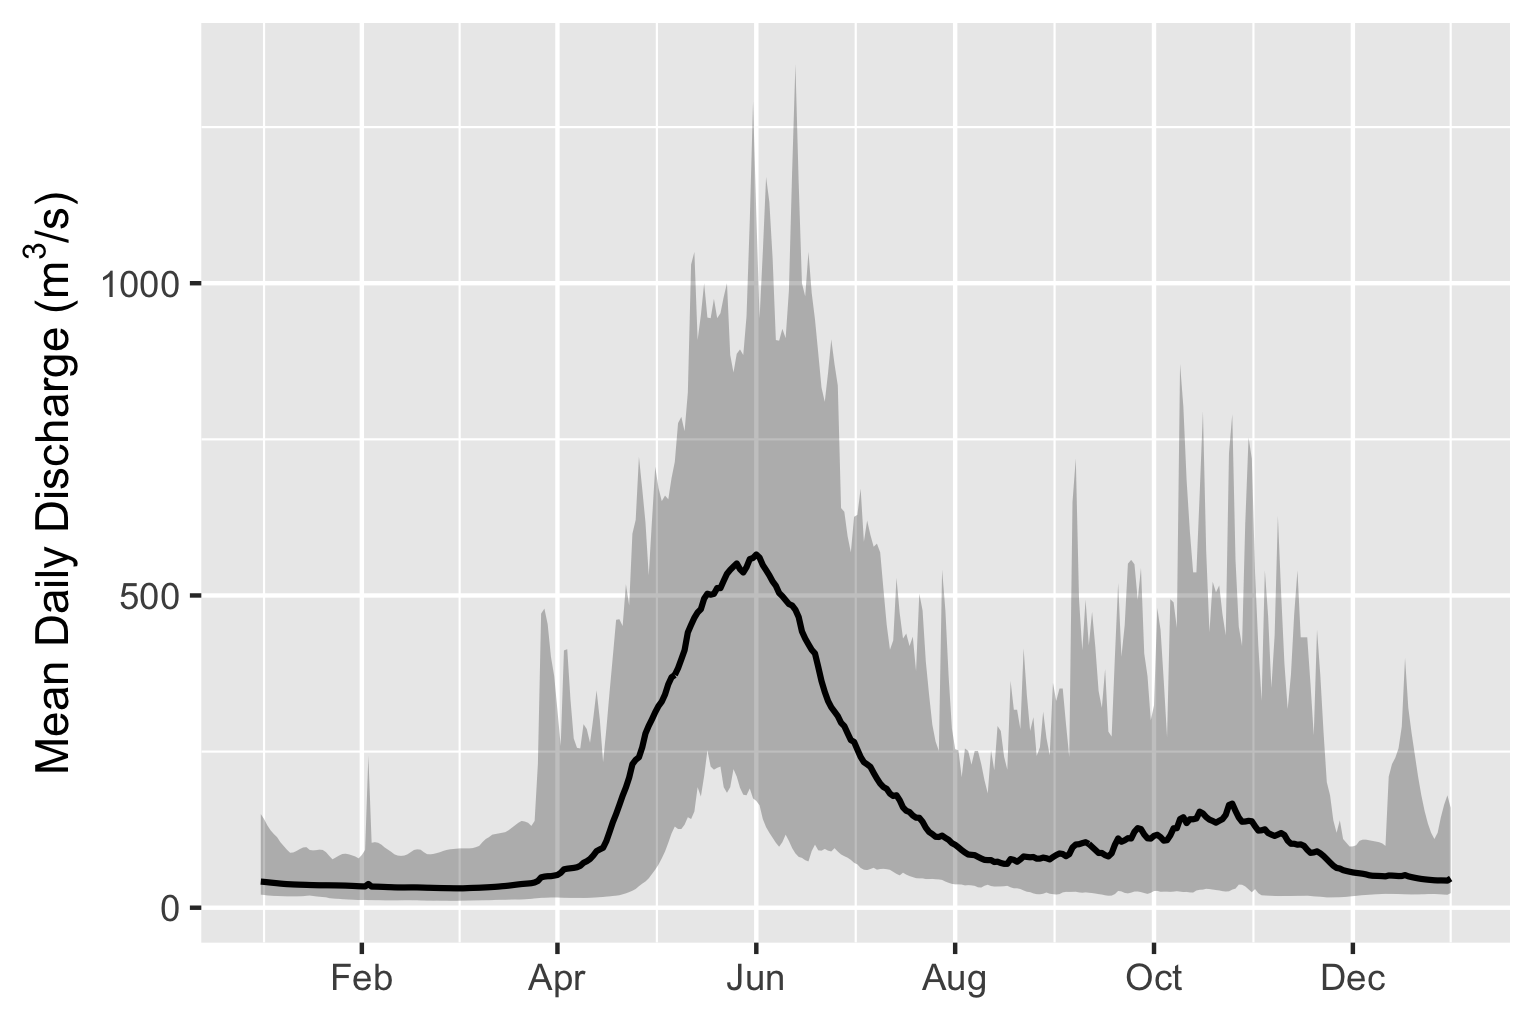
Figure 2: Parsnip River Above Misinchinka River (Station #07EE007 - Lat 55.08194 Lon -122.913063). Available daily discharge data from 1967 to 2019.
# img <- png::readPNG("fig/hydrology2.png")
# grid::grid.raster(img)

knitr::include_graphics("fig/hydrology_stats_pdf_07EE007.png")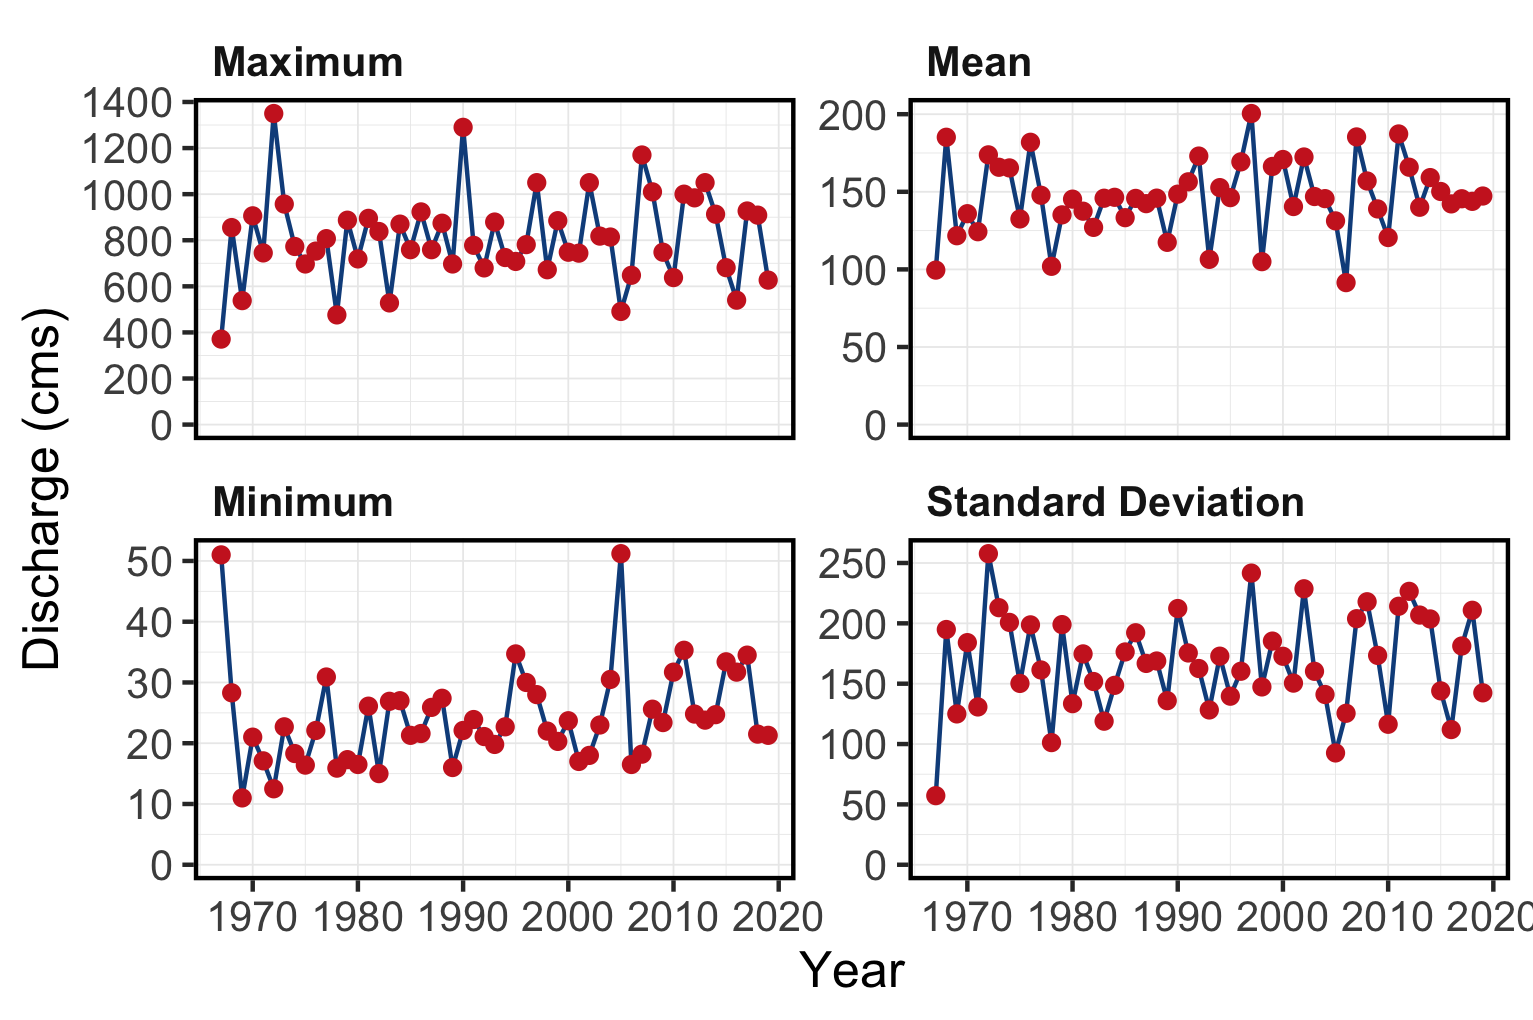
Figure 3: Summary discharge statistics (annual maximum, minimum, mean and standard deviation) for Parsnip River at hydrometric station #07EE007.
Fisheries
Fish species recorded in the Parsnip River watershed are detailed in Table 1 (MoE 2019a). In addition to flooding related to the formation of the Williston Reservoir, transmission lines, gas pipelines, rail, road networks, forestry, elevated water temperatures, interrupted connectivity, invasion from non-native species and insect infestations affecting forested areas pose threats to fisheries values in the Parsnip River watershed (Hagen et al. 2015b; Stamford, Hagen, and Williamson 2017b; Hagen and Weber 2019a; Comittee on the Status of Endangered Wildlife in Canada 2012). A brief summary of trends and knowledge status related to Arctic grayling, bull trout, kokanee, mountain whitefish and rainbow trout in Williston Watershed streams is provided in Fish and Wildlife Compensation Program (2020) with a more detailed review of the state of knowledge for Parsnip River watershed populations of Arctic grayling and bull trout provided below.
fiss_species_table <- readr::read_csv(paste0(getwd(), '/data/inputs_extracted/fiss_species_table.csv'))

fiss_species_table %>%
fpr::fpr_kable(caption_text = 'Fish species recorded in the Parsnip River watershed group.', scroll = gitbook_on)| Scientific Name | Species Name | Species Code | BC List | Provincial FRPA | COSEWIC | SARA |
|---|---|---|---|---|---|---|
| Catostomus catostomus | Longnose Sucker | LSU | Yellow | – | – | – |
| Catostomus commersonii | White Sucker | WSU | Yellow | – | – | – |
| Catostomus macrocheilus | Largescale Sucker | CSU | Yellow | – | – | – |
| Coregonus clupeaformis | Lake Whitefish | LW | Yellow | – | – | – |
| Cottus aleuticus | Coastrange Sculpin (formerly Aleutian Sculpin) | CAL | Yellow | – | – | – |
| Cottus asper | Prickly Sculpin | CAS | Yellow | – | – | – |
| Cottus cognatus | Slimy Sculpin | CCG | Yellow | – | – | – |
| Couesius plumbeus | Lake Chub | LKC | Yellow | – | DD | – |
| Lota lota | Burbot | BB | Yellow | – | – | – |
| Mylocheilus caurinus | Peamouth Chub | PCC | Yellow | – | – | – |
| Oncorhynchus mykiss | Rainbow Trout | RB | Yellow | – | – | – |
| Oncorhynchus nerka | Kokanee | KO | Yellow | – | – | – |
| Osmerus dentex | Rainbow Smelt | RSM | Unknown | – | – | – |
| Prosopium coulterii | Pygmy Whitefish | PW | Yellow | – | NAR (Nov 2016) | – |
| Prosopium cylindraceum | Round Whitefish | RW | Yellow | – | – | – |
| Prosopium williamsoni | Mountain Whitefish | MW | Yellow | – | – | – |
| Ptychocheilus oregonensis | Northern Pikeminnow | NSC | Yellow | – | – | – |
| Rhinichthys cataractae | Longnose Dace | LNC | Yellow | – | – | – |
| Richardsonius balteatus | Redside Shiner | RSC | Yellow | – | – | – |
| Salvelinus confluentus | Bull Trout | BT | Blue | Y (Jun 2006) | SC (Nov 2012) | – |
| Salvelinus fontinalis | Brook Trout | EB | Exotic | – | – | – |
| Salvelinus malma | Dolly Varden | DV | Yellow | – | – | – |
| Salvelinus namaycush | Lake Trout | LT | Yellow | – | – | – |
| Thymallus arcticus | Arctic Grayling | GR | Yellow | – | – | – |
Bull Trout - sa’ba
Bull Trout populations of the Williston Reservoir watershed are included within the Western Arctic population ‘Designatable Unit 10’, which, in 2012, received a ranking of ‘Special Concern’ by the Committee on the Status of Endangered Wildlife in Canada (COSEWIC 2012). They were added to Schedule 1 under the Species of Risk Act in 2019 (Species Registry Canada 2020) and are also considered of special concern (blue-listed) provincially (BC Species & Ecosystem Explorer 2020). Some or all of the long-term foot survey index sections of four Williston Reservoir spawning tributaries (Davis Creek, Misinchinka River, Point Creek, and Scott Creek), have been surveyed within 16 of the 19 years between 2001 and 2019 (16 of 19 in Davis River, 10 years over a 13-year period in the Misinchinka River, 11 years over a 14-year period for Point Creek, and 9 years over an 11-year period for Scott Creek (Hagen, Spendlow, and Pillipow 2020).
A study of sa’ba critical habitats in the Parsnip River was conducted in 2014 with the Misinchinka and Anzac systems identified as the most important systems for large bodied bull trout spawners accounting for a combined total of 65% of spawners counted. The Table River was also highlighted as an important spawning destination accounting for an estimated 15% of the spawners. Other watersheds identified as containing runs of large bodied bull troutspawners included the Colbourne, Reynolds, Hominka and Missinka River with potentially less than 50 spawners utilizing each sub-basin (Hagen et al. 2015a). Hagen and Weber (2019b) have synthesized a large body of information regarding limiting factors, enhancement potential, critical habitats and conservation status for bull trout of the Williston Reservoir and the reader is encouraged to review this work for context. They have recommended experimental enhancements within a monitoring framework for Williston Reservoir bull trout (some spawning and rearing in Parsnip River mainstem and tributaries) which include stream fertilization, side channel development, riparian restoration and fish access improvement.
In 2018, sub-basins of the Anzac River watershed, Homininka River, Missinka River and Table River watersheds were designated as fisheries sensitive watersheds under the authority of the Forest and Range Practices Act due to significant downstream fisheries values and significant watershed sensitivity (Beaudry 2013a, 2014a, 2014b, 2013c). Special management is required in these watersheds to protect habitat for fish species including bull trout and Arctic grayling including measures (among others) to limit equivalent clearcut area, reduce impacts to natural stream channel morphology, retain old growth attributes and maintain fish habitat/movement (Forest and Range Practices Act 2018).
Tse’khene Elders from the McLeod Lake Indian Band report that sa’ba (bull trout) size and abundance has decreased in all rivers and tributaries from the reservoir with more injured and diseased fish captured in recent history than was common in the past (Pearce 2019).
Arctic Grayling - dusk’ihje
A detailed review of dusk’ihje life history can be referenced in Stamford, Hagen, and Williamson (2017b). Since impoundment of the Williston Reservoir, it appears that physical habitat and ecological changes have been the most significant factors limiting Arctic grayling productivity. Although these changes are not well understood they have likely resulted in the inundation of key low gradient juvenile rearing and overwintering habitats, isolation of previously connected populations and increases in abundance of predators such as bull trout (Shrimpton, Roberts, and Clarke 2012; Hagen, Pillipow, and Gantner 2018).
Migration of mature adult dusk’ihje (Arctic grayling) occurs in the spring with arrival at known spawning locations coinciding with water temperatures of 4\(^\circ\)C. Spawning in the Parsnip watershed appears to occur between late-May and late-June within sites located primarily within the lower reaches of the Anzac and Table rivers as well as within the Parsnip River mainstem. Side-channel and multiple-channel locations containing small gravels appear to be selected for spawning. Currently, the primary distribution of Williston Arctic grayling appears to be among fourth order and larger streams (Williamson and Zimmerman 2005; Stamford, Hagen, and Williamson 2017b). Stewart et al. (2007) report that Arctic grayling spawn in large and small tributaries to rivers and lakes, intermittent streams, within mainstem rivers as well as lakes, most commonly at tributary mouths. Although past study results indicate that 0+ grayling appeared to overwinter in lower reaches of larger tributaries (i.e. Table, Anzac rivers) as well as the Parsnip River and that few age-1+ grayling have been sampled in tributaries, habitat use in small tributaries and the extent they are connected with the mainstem habitats of all core areas is not well understood. Between 1995 and 2019, Arctic grayling population monitoring has been conducted in the Table River in nine out of 25 years (8 years for the Anzac) using snorkel surveys. Results from 2018 are 2019 are intended to contribute to the assessment of the conservation status of the species in the Parsnip Core area (Hagen, Pillipow, and Gantner 2018).
Tse’khene Elders from the McLeod Lake Indian Band report that Arctic grayling numbers have declined dramatically since the flooding of the reservoir and that few dusk’ihje (Arctic Grayling) have been caught in the territory in the past 30 years (Pearce 2019).
A review of available fisheries data for the Parsnip River watershed stratified by different habitat characteristics can provide insight into which habitats may provide the highest intrinsic value for fish species based on the number of fish captured in those habitats in past assessment work (Figures 4 - 6). It should be noted however that it should not be assumed that all habitat types have been sampled in a non-biased fashion or that particular sites selected do not have a disproportionate influence on the overall dataset composition (ie. fish salvage sites are often located adjacent to construction sites which are more commonly located near lower gradient stream reaches).
# fiss_sum <- readr::read_csv(file = paste0(getwd(), '/data/extracted_inputs/fiss_sum.csv'))
fiss_sum_grad <- readr::read_csv(file = paste0(getwd(), '/data/inputs_extracted/fiss_sum_grad.csv'))
fiss_sum_width <- readr::read_csv(file = paste0(getwd(), '/data/inputs_extracted/fiss_sum_width.csv'))
fiss_sum_wshed <- readr::read_csv(file = paste0(getwd(), '/data/inputs_extracted/fiss_sum_wshed.csv'))

# A summary of historical westslope cutthrout trout observations in the Elk River watershed group by average gradient category of associated stream segment is provided in Figure \@ref(fig:fish-wct-bar). Of `r wct_elkr_grad %>% filter(gradient_id == 3) %>% pull(total)` observations, `r wct_elkr_grad %>% filter(gradient_id == 3) %>% pull(Percent) + wct_elkr_grad %>% filter(gradient_id == 5) %>% pull(Percent) + wct_elkr_grad %>% filter(gradient_id == 8) %>% pull(Percent)`% were within stream segments with average gradients ranging from 0 - 8%.  A total of `r wct_elkr_grad %>% filter(gradient_id == 3) %>% pull(Percent)`% of historic observations were within stream segments with gradients between 0 - 3%, `r wct_elkr_grad %>% filter(gradient_id == 5) %>% pull(Percent)`% were within stream segments with gradients ranging from 3 - 5% and `r wct_elkr_grad %>% filter(gradient_id == 5) %>% pull(Percent)`% were within stream segments with gradients between 5 - 8% [@data_fish_obs; @norris2020bcfishobs].
my_caption <- 'Summary of historic salmonid observations vs. stream gradient category for the Parsnip River watershed group.'
fiss_sum_grad %>%
select(-gradient_id) %>%
fpr::fpr_kable(caption_text = my_caption,
scroll = gitbook_on)| species_code | Gradient | Count | total_spp | Percent |
|---|---|---|---|---|
| BT | 0 - 3 % | 160 | 236 | 68 |
| BT | 03 - 5 % | 29 | 236 | 12 |
| BT | 05 - 8 % | 21 | 236 | 9 |
| BT | 08 - 15 % | 20 | 236 | 8 |
| BT | 15 - 22 % | 6 | 236 | 3 |
| GR | 0 - 3 % | 224 | 230 | 97 |
| GR | 03 - 5 % | 2 | 230 | 1 |
| GR | 05 - 8 % | 2 | 230 | 1 |
| GR | 08 - 15 % | 2 | 230 | 1 |
| KO | 0 - 3 % | 17 | 17 | 100 |
| RB | 0 - 3 % | 327 | 415 | 79 |
| RB | 03 - 5 % | 32 | 415 | 8 |
| RB | 05 - 8 % | 22 | 415 | 5 |
| RB | 08 - 15 % | 27 | 415 | 7 |
| RB | 15 - 22 % | 7 | 415 | 2 |
##bar graph
plot_grad <- fiss_sum_grad %>%
  filter(gradient_id != 99) %>%
  ggplot(aes(x = Gradient, y = Percent)) +
  geom_bar(stat = "identity")+
  facet_wrap(~species_code, ncol = 2)+
  # ggdark::dark_theme_bw(base_size = 11)+
  labs(x = "Average Stream Gradient", y = "Occurrences (%)")
plot_grad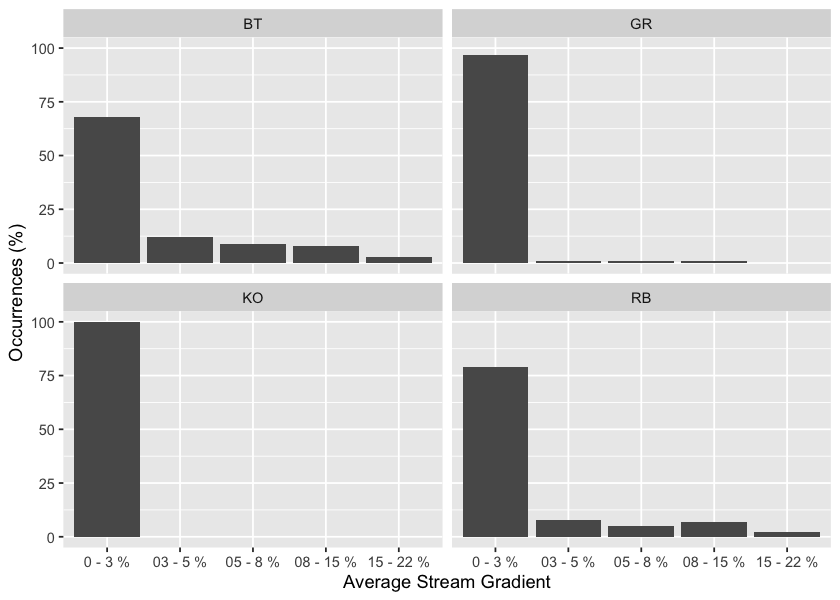
Figure 4: Summary of historic salmonid observations vs. stream gradient category for the Parsnip River watershed group.
my_caption <- 'Summary of historic salmonid observations vs. channel width category for the Parsnip River watershed group.'
fiss_sum_width %>%
  select(-width_id) %>%
  fpr::fpr_kable(caption_text = my_caption,
scroll = gitbook_on)| species_code | Width | Count | total_spp | Percent |
|---|---|---|---|---|
| BT | 0 - 2m | 11 | 236 | 5 |
| BT | 02 - 04m | 25 | 236 | 11 |
| BT | 04 - 06m | 29 | 236 | 12 |
| BT | 06 - 10m | 35 | 236 | 15 |
| BT | 10 - 15m | 30 | 236 | 13 |
| BT | 15m+ | 103 | 236 | 44 |
| BT | – | 3 | 236 | 1 |
| GR | 04 - 06m | 5 | 230 | 2 |
| GR | 06 - 10m | 7 | 230 | 3 |
| GR | 10 - 15m | 14 | 230 | 6 |
| GR | 15m+ | 200 | 230 | 87 |
| GR | – | 4 | 230 | 2 |
| KO | 0 - 2m | 1 | 17 | 6 |
| KO | 06 - 10m | 3 | 17 | 18 |
| KO | 15m+ | 1 | 17 | 6 |
| KO | – | 12 | 17 | 71 |
| RB | 0 - 2m | 23 | 415 | 6 |
| RB | 02 - 04m | 51 | 415 | 12 |
| RB | 04 - 06m | 37 | 415 | 9 |
| RB | 06 - 10m | 36 | 415 | 9 |
| RB | 10 - 15m | 34 | 415 | 8 |
| RB | 15m+ | 141 | 415 | 34 |
| RB | – | 93 | 415 | 22 |
##bar graph
plot_width <- fiss_sum_width %>%
  filter(!is.na(width_id)) %>%
  ggplot(aes(x = Width, y = Percent)) +
  geom_bar(stat = "identity")+
  facet_wrap(~species_code, ncol = 2)+
  # ggdark::dark_theme_bw(base_size = 11)+
  labs(x = "Channel Width", y = "Occurrences (%)")
plot_width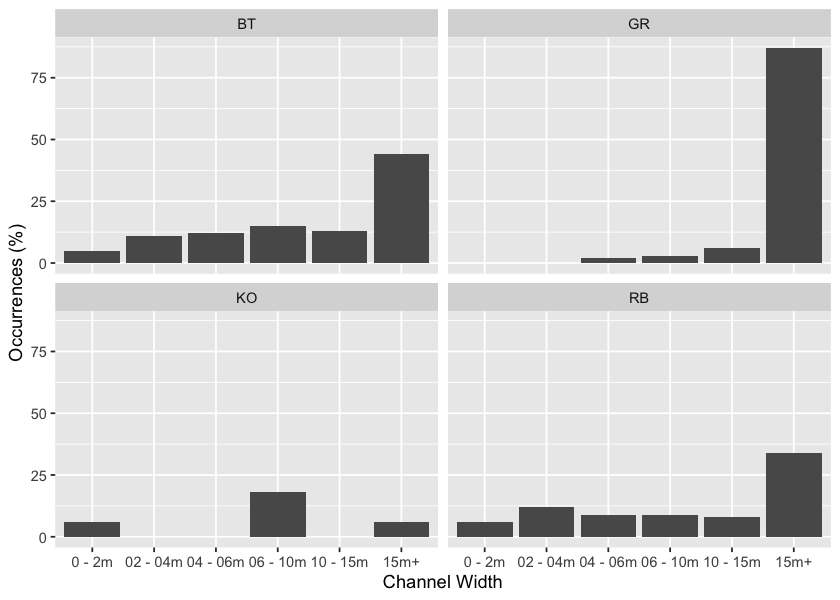
Figure 5: Summary of historic salmonid observations vs. channel width category for the Parsnip River watershed group.
my_caption <- 'Summary of historic salmonid observations vs. watershed size category for the Parsnip River watershed group.'
fiss_sum_wshed %>%
  fpr::fpr_kable(caption_text = my_caption,
scroll = gitbook_on)| species_code | Watershed | count_wshd | total_spp | Percent |
|---|---|---|---|---|
| BT | 0 - 25km2 | 89 | 236 | 38 |
| BT | 25 - 50km2 | 27 | 236 | 11 |
| BT | 50 - 75km2 | 12 | 236 | 5 |
| BT | 75 - 100km2 | 9 | 236 | 4 |
| BT | 100km2+ | 99 | 236 | 42 |
| GR | 0 - 25km2 | 7 | 230 | 3 |
| GR | 25 - 50km2 | 5 | 230 | 2 |
| GR | 50 - 75km2 | 9 | 230 | 4 |
| GR | 75 - 100km2 | 6 | 230 | 3 |
| GR | 100km2+ | 203 | 230 | 88 |
| KO | 0 - 25km2 | 11 | 17 | 65 |
| KO | 25 - 50km2 | 1 | 17 | 6 |
| KO | 50 - 75km2 | 2 | 17 | 12 |
| KO | 75 - 100km2 | 2 | 17 | 12 |
| KO | 100km2+ | 1 | 17 | 6 |
| RB | 0 - 25km2 | 210 | 415 | 51 |
| RB | 25 - 50km2 | 22 | 415 | 5 |
| RB | 50 - 75km2 | 26 | 415 | 6 |
| RB | 75 - 100km2 | 17 | 415 | 4 |
| RB | 100km2+ | 140 | 415 | 34 |
plot_wshed <- fiss_sum_wshed %>%
  # filter(!is.na(upstream_area_ha)) %>%
  ggplot(aes(x = Watershed, y = Percent)) +
  geom_bar(stat = "identity")+
  facet_wrap(~species_code, ncol = 2)+
  # ggdark::dark_theme_bw(base_size = 11)+
  labs(x = "Watershed Area", y = "Occurrences (%)")+
  theme(axis.text.x=element_text(angle = 45, hjust = 1))
plot_wshed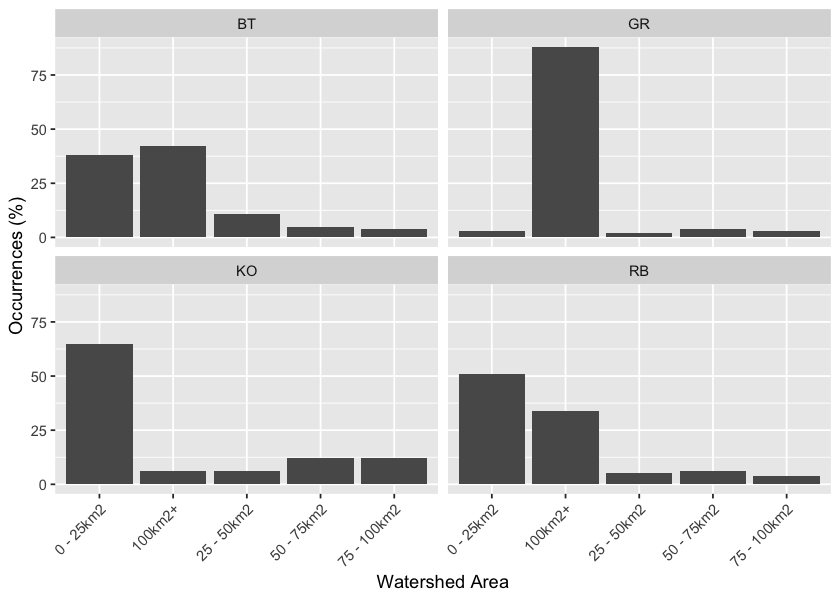
Figure 6: Summary of historic salmonid observations vs. watershed size category for the Parsnip River watershed group.