10 Mapping
We use QGIS and Mergin Maps for our fish passage data management and analysis. This section will get you started with our mapping procedures.
10.1 QGIS
QGIS (Quantum Geographic Information System) is a free, open-source software that allows users to create, edit, visualize, analyze, and publish geospatial information.
Follow this link to the QGIS Download Page to install the latest version.
Here is some great info for getting up to speed with the basics of QGIS
10.1.1 Common actions
Below are some common actions we use in QGIS.
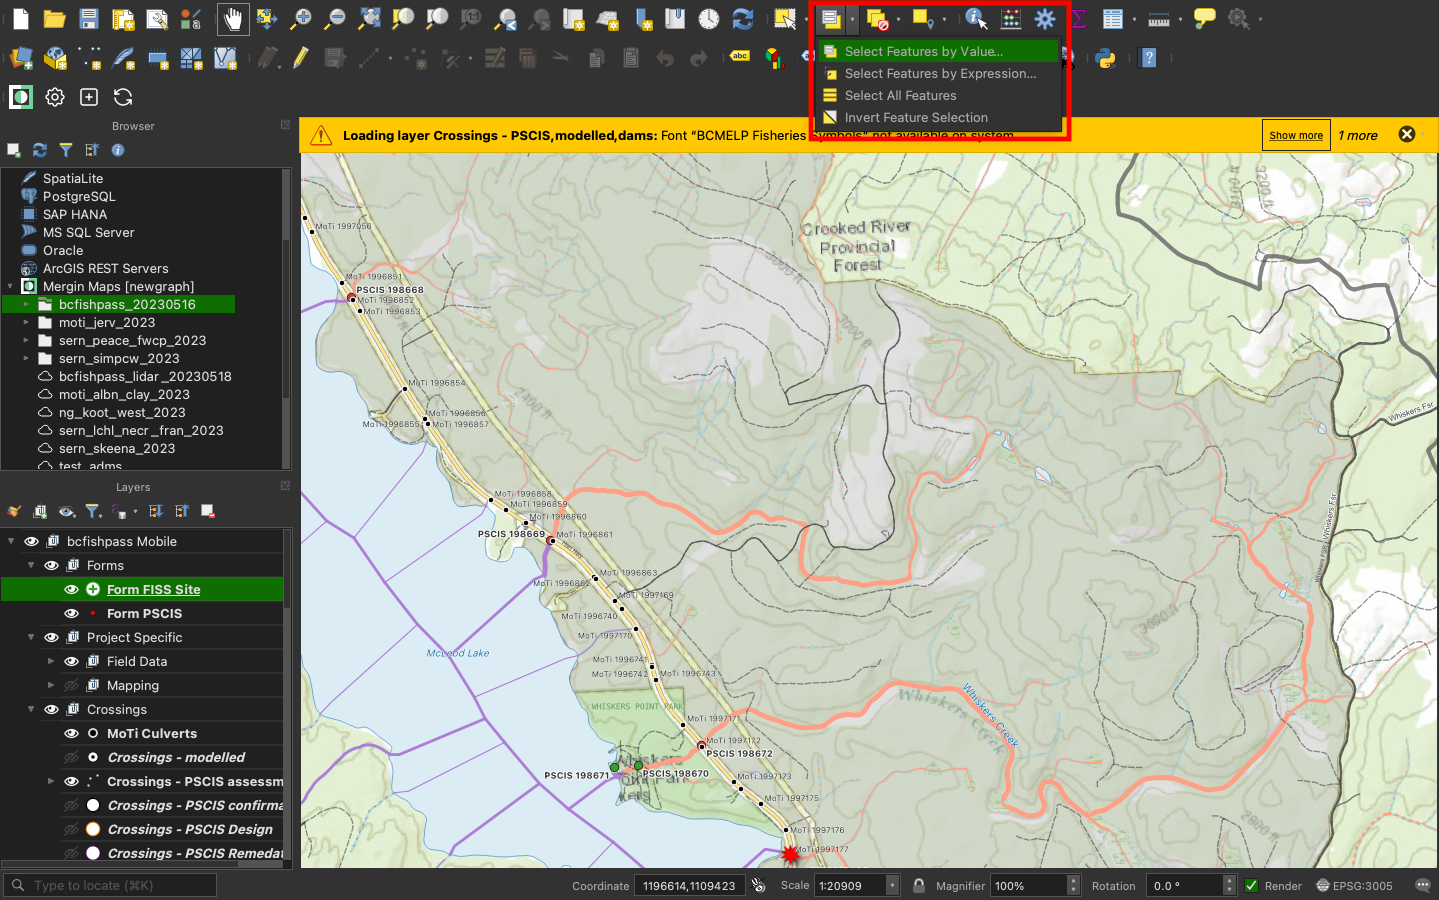
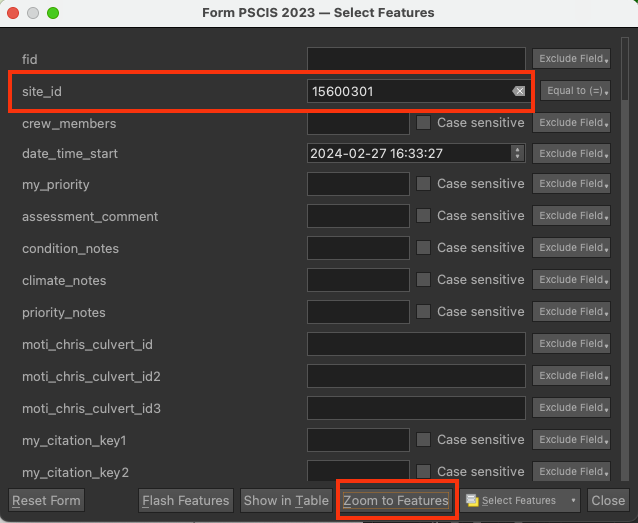
- Finding a feature such as a culvert, stream, or basically anything on the map. Use
Select feature by value. Then input your search term and selectzoom to feature, for example looking for the site15600301.
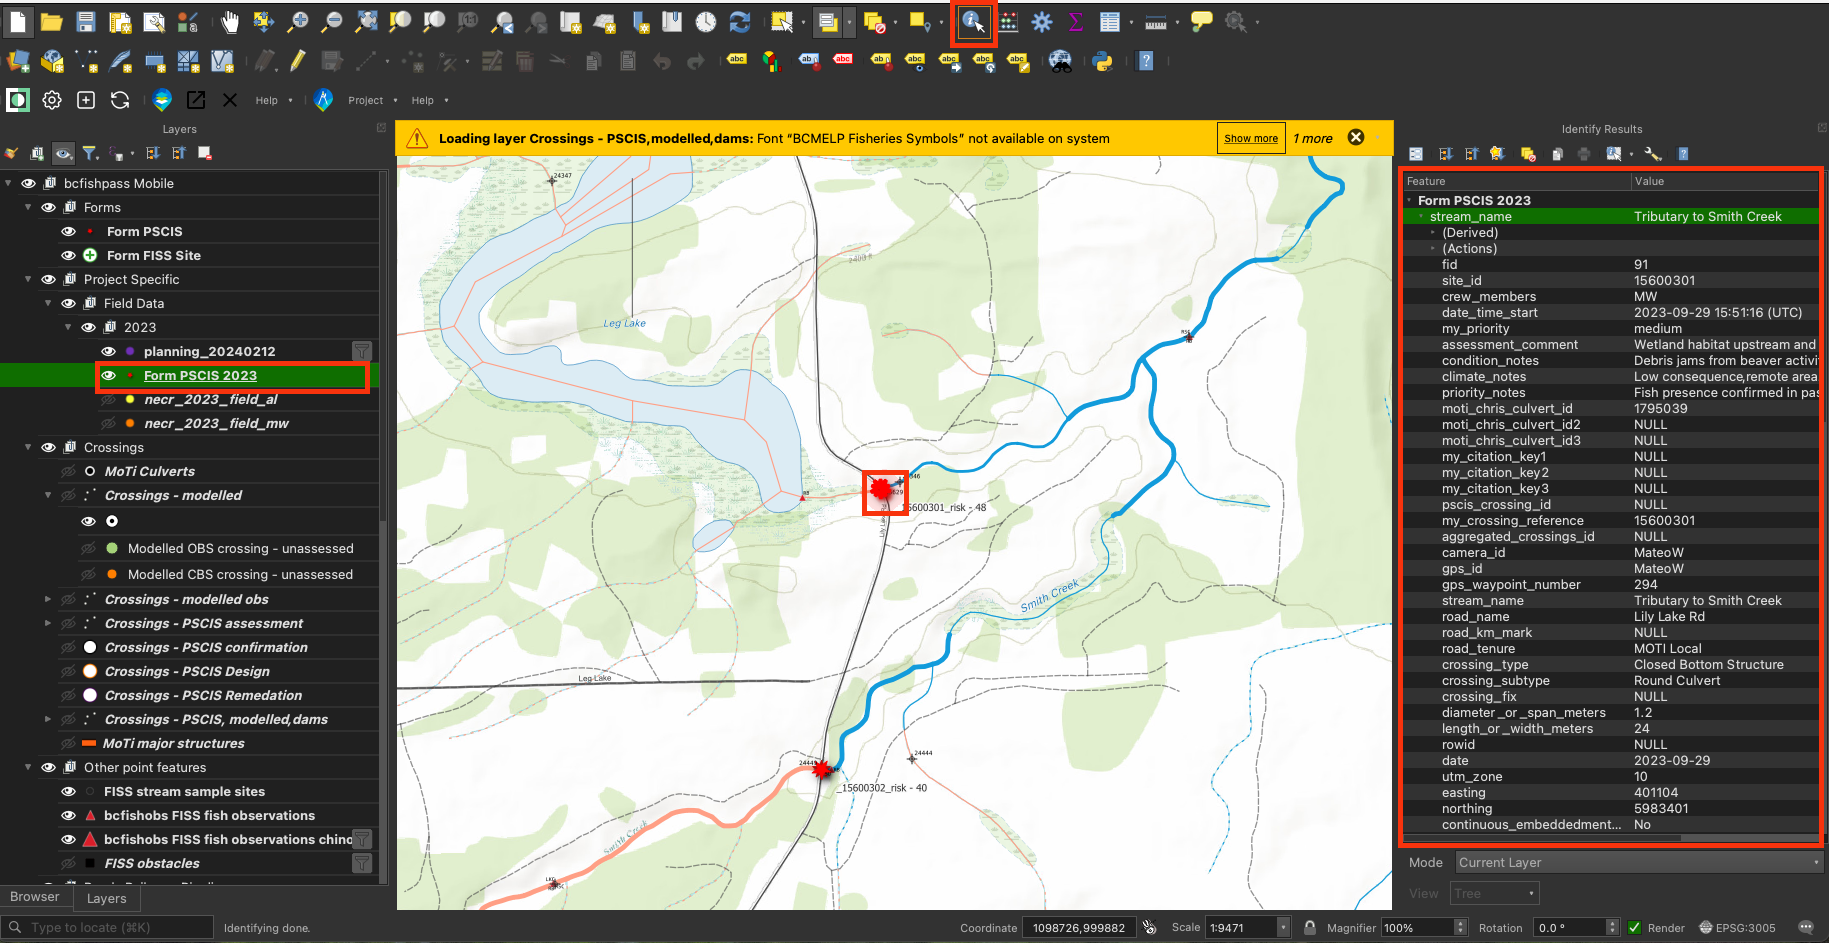
- Getting information about a feature (“Identify Feature”). Make sure you have the layer selected, then Select the “Identify Features” tool and click on the feature you want to know more about.
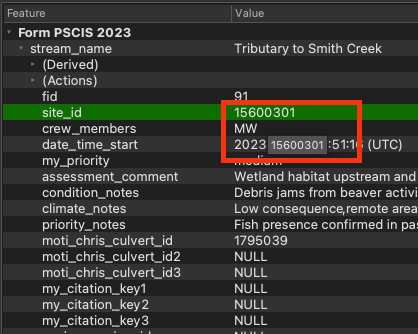
- Copy information from a feature. Select the row then hover your cursor over the text you want to copy then
cmd+cto copy.
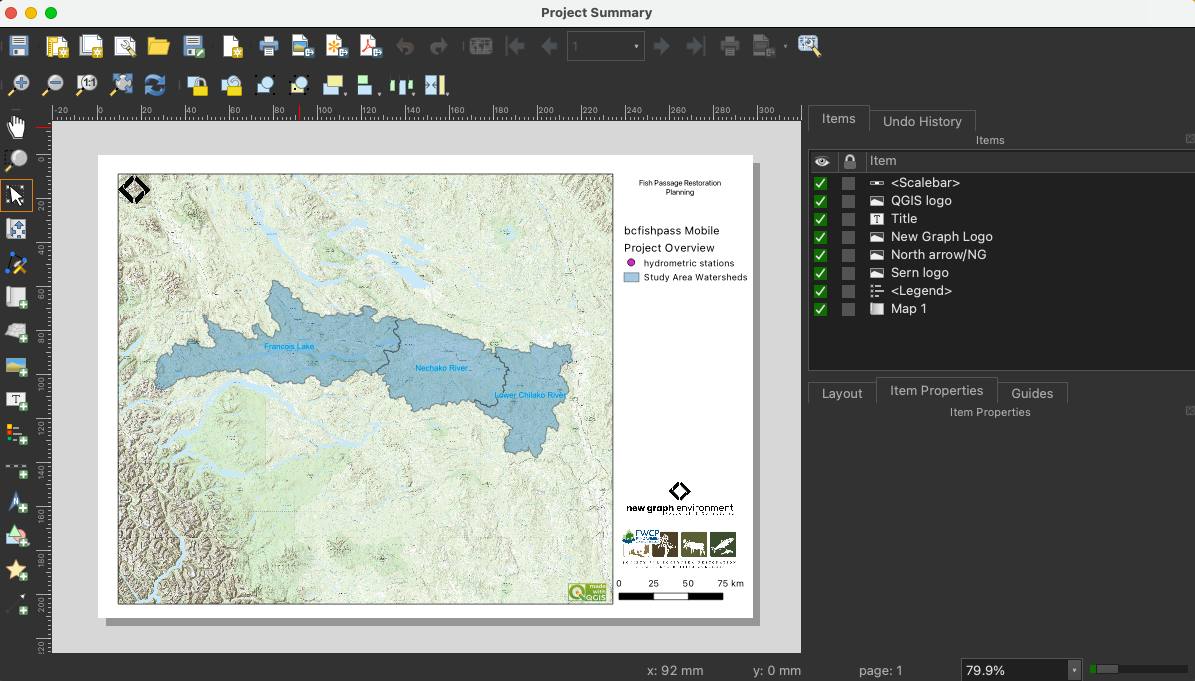
- Creating maps with
Projects/print layout. This is where you can create a map that can be exported as an image or pdf. Below is an example of a map layout. Check out this video for how to make maps.
10.2 Mergin Maps
Mergin is a geodata platform that allows us to collaborate with others by collecting data in the field and syncing to a shared QGIS project. Check out the Mergin Maps documentation for more information.
Set up Mergin Maps with QGIS:
Follow the instruction to sign up for a free mergin account
Make sure you have installed QGIS
Install the Mergin Maps plugin
Install the Mergin Maps app on your phone (we use this during field season)
We will send you an invitation to join the
newgraphMergin workspace.
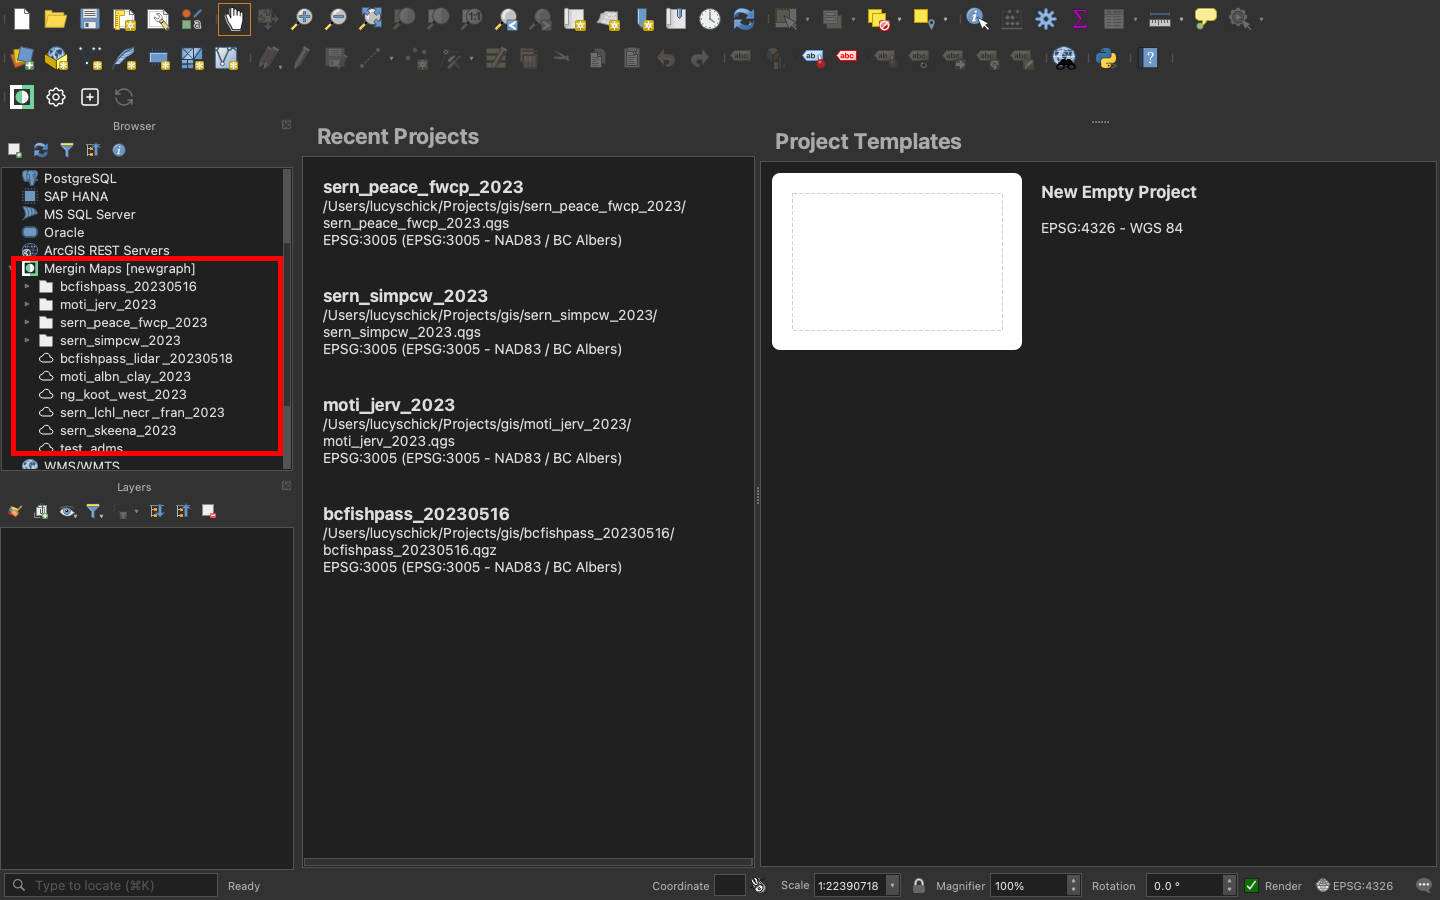
Once you have accepted the invitation, our project will show up in the “Mergin Maps” tab of the “Browser” window (see screenshot below). From there, right click and you “Download” the projects to somewhere you will keep them permanently (directory called GIS on my machine). Then you should be able to open the projects and see what we see and when people add data it syncs.
10.2.1 Office
Project creation is done with
bcdata.shandbackground_layers.shfound in https://github.com/NewGraphEnvironment/dff-2022/tree/master/scripts/qgis. See the readme for instructions.There is a directory in the project called
ignore_mobilewhich contain the site photos. The project directory also contains the methods and templates for paper data collection, as well as the excel files that are used to upload the data to the province. The provincial method documents are obviously key to review, print and have on hand in the field.To understand how the modelling for fish habitat works you can review the settings we use in bcfishpass. We used the channel width method for our projects.
the whole setup is quite beta and it is not straightforward at this time to get the data from the form geopackage in QGIS into the templates used for data submission to the province we are using
*_tidy.Rscripts to do that and they are evolving over time here ( https://github.com/NewGraphEnvironment/dff-2022/tree/master/scripts ).
10.2.2 Labelling
It is important to develop workflows to streamline labelling and avoid hand work in the map layout viewer. Helpful details and tips include:
- Avoid labelling in the map layout viewer, as soon as your project map changes you have to redo labels.
- Adjust/move labels in the project view, using the abc labels (shown below)

- Align labels in project view by using the “View current map extent in main canvas” button in the layout viewer.
- If you need to add labels by hand sometimes you can add a line layer with no symbology and add features with a “label” field. Then you can put them where you want and they will be flexible if you shift your map around.
- Another technique is duplicating layers for a particular layout and changing the label symbology.
10.2.3 Field Data Entry into Mergin
- Over the last year we have seen uncommon issues with syncing and data corruption that provide even more incentive to be sure to do paper copies of the forms as well. - There are links to the methods docs in the forms with the intention that you can save them to your phone. Obviously, the provincial method documents are key.
- Switching between themes is very useful in the field. You can add more in QGIS.
- We find that Mergin works much better (faster rendering) with airplane mode on.
- Site ID is important:
- If a site has a PSCIS ID then that is used as the identifier.
- If there is no PSCIS ID we use the “Crossing - Modelled ID” (a.k.a “My Crossing Reference”) as the “Modelled ID”. If there is neither (rare but usually occurs when a stream is not mapped) we use a numeric ID based on the date (YYYYMMDD01 - example 2023070502 - would be our second assessment for today).
- If there is an associated chris_culvert_id (“MoTi” identifier) we include that as well. We take a photo of the road with the PSCIS ID or Modelled ID in the corner and upload photos to mergin that are
- When we first arrive at a site we take a photo of the road with the PSCIS ID or Modelled ID in the corner. This allows easy reference to which photos are for which sites. When we are done filling out the paper form we take a photo of it (for data backup and to make it easy to see which photos are from where).
- At this point in time the climate change metrics are a touch subjective and poorly defined. We will be refining them later but for now it is effective for comparing one site to the next. Keen on your feedback as this was passed on to us as is and we have some ideas too about ways to simplify/standardize things.
- The “FDS” and “Site Card/Fish form” stuff in the “ignore_mobile/templates” directory are what we use for Habitat Confirmation (Phase 2) work as it allows us to standardize data collection and upload more detailed habitat/fish information to the province.
10.3 LiDAR
Light detection and ranging (LiDAR) is a technology that can be used to create high resolution Digital Elevation Models (DEMs). These DEMs can give us a better idea of what is happening in a watershed at a site of interest.
- LiDAR point cloud data and DEMs can be found on the LiDAR BC Portal.
- Downloading DEMs is the way to go. However, if there is only LiDAR point cloud data available then you can convert to a DEM. A tutorial on the process can be found on OneDrive here.
- We can link directly to online data using raster/https connection (example shown in screenshot below)
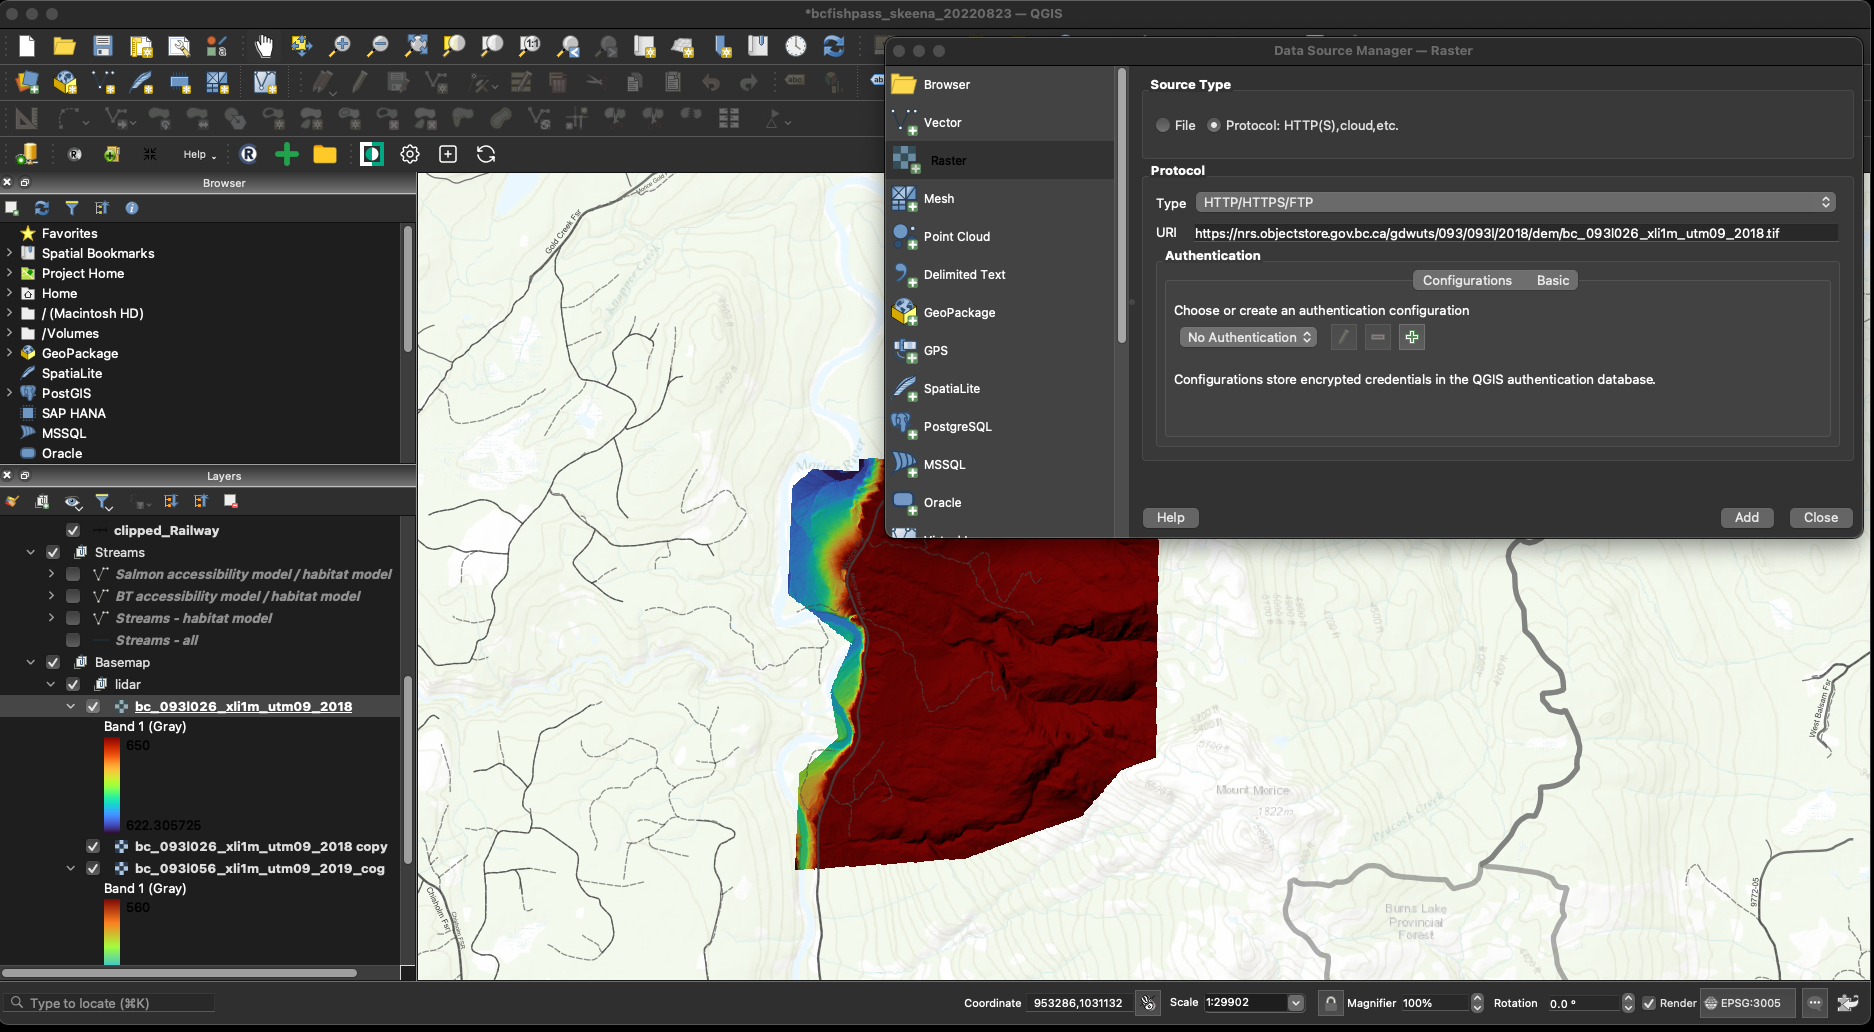
Figure 10.1: How to connect to raster in QGIS data source manager