Appendix - 62181 & 62182 - Dry Creek
Site Location
PSCIS crossing 62181 is located on Dry Creek on the CP Railway 11km east of Elkford, BC. PSCIS crossing 62182 is located approximately 30m downstream of the railway on the Fording Highway. The Fording Highway is detailed as a local road within the municipal boundaries of the District of Elkford with the Ministry of Transportation and Infrastructure detailed as a custodian partner within the digital road atlas (FLNRORD 2020b). The road accesses the Fording River Operations which is a steelmaking coal operation owned by Teck Coal Limited.
Background
Dry Creek drains in a northern direction to the confluence with the Fording River at a location approximately 10km east of Elkford, BC. At crossing 62181, Dry Creek is a fourth order stream with a watershed area upstream of the crossing of approximately 25.5km2. The elevation of the watershed ranges from a maximum of 2280 to 1540m at PSCIS crossing 62181. Dry Creek is known to contain westslope cutthroat trout upstream of the subject culvert (MoE 2020a; Norris 2020). There are numerous stream crossing structures located on Dry Creek upstream of 62181 however there are no crossings assessed as barriers on the mainstem to directly below the location of the wasterock as indicated by aerial imagery. Dry Creek drains into to the Fording River upstream of Josephine Falls, a 25 m waterfall that limits the upstream passage of fish (Teck Coal Limited Line Creek Operations 2009).
fpr_tab_wshd_sum(site_id = my_site) %>%
  my_kable(caption_text = paste0('Summary of derived upstream watershed statistics for PSCIS crossing ', my_site, '.'),
footnote_text = 'Elev P60 = Elevation at which 60% of the watershed area is above')| Site | Area Km | Elev Site | Elev Min | Elev Max | Elev Mean | Elev Median | Elev P60 |
|---|---|---|---|---|---|---|---|
| 62181 | 25.5 | 1532 | – | 2594 | 2061 | 2078 | 2019 |
| * Elev P60 = Elevation at which 60% of the watershed area is above |
The upper end of the watershed is within Phase II of Teck Coal Limited’s (Teck) – Line Creek Operation area (LCOII). Hasek and Batchelar (2021) report that waste rock placement in the watershed began in 2015. A review of aerial imagery from March of 2021 indicated that the total area of waste rock placement within the watershed was approximately 300ha. In order to comply with discharge requirements for total suspended solids (Permit 106970), Teck began operating the Line Creek Operation Dry Creek Water Management System (LCODCWMS) in 2015. The LCODCWMS collects upper Dry Creek water in a headpond which then conveys the water into two lined sedimentation ponds. Discharge from the sedimentation ponds is subsequently combined and is conveyed to a constructed discharge channel which flows continuously into Dry Creek downstream. The Line Creek Operations Local Aquatic Effects Monitoring Program (LCOLAEMP) to assess potential effects of Line Creek Operations on Dry Creek, Grace Creek and an Unnamed Creek has been in operation since 2014 as per another LCOII permitting requirement (Hasek and Batchelar 2021). A Structured Decision Making (SDM) process was initiated in 2016 to develop recommendations for water qualty site performatnce objective (SPOs) and in-stream flow requirements (IFRs) for Dry Creek, along with an updated LCO Dry Creek Water Management Plan that included water management activities, physical ,works, and LCOII operational procedures with the entent to acheieve the recommneded SPOs and IFRs, to inform monitoring as well as adaptive management recommendations. The SDM process includes a working group comprised of Ktunaxa Nation Council; BC Ministry of Environment; Ministry of Forests, Lands, Natural Resource Operations and Rural Development; the Ministry of Energy, Mines and Petroleum Resources; Fisheries and Oceans Canada and Teck. The SDM process develops operational recommendations informed throughout the year by the LCOLAEM with results from 2020 summarized below (Hasek and Batchelar 2021).
- Aqueous concentrations of nitrate, sulphate, nickel, selenium, total cadmium, and other constituents were greater within Dry Creek than reference and normal ranges with frequent guideline and benchmark exceedances.
- Water collected at the outlet of the LCODCWMS had no increases in acute toxicity in 2020 and water sampled from within Dry Creek had no change in frequency or severity of potential adverse responses in chronic toxicity testing.
- Multiple metrics of benthic invertebrate community composition that indicate negative water quality effects (decreasing %Ephemeroptera , decreaseing %EPT, increasing %Chironomidae) were noted at multiple Dry Creek sample sites in 2020.
- Benthic invertebrate tissue selenium concentrations were observed to be greater than normal range in samples from all areas
downstream of the LCODCWMS.
- In response to 3 and 4, operational changes to the LCODCWMS were implemented in 2020 to minimize the retention time in the pond to reduce bioaccumulation of selenium. Water from the headpond bypassed the sedimentation ponds seasonally, only filling them during freshet and higher-flow periods.
A pipeline and power line corridor (Dry Creek Water Conveyance and Supplementation Project) are currently under construction in the watershed to mitigate the risks to the water quality / flow regulation in Dry Creek and meet site performance measures and instream flow requirements (Burns et al. 2021; Chapman and Hatfield 2021). The project infrastructure will collect mine-affected water in the headwaters of Dry Creek and divert it into the Fording River while water from the Fording River upstream of the Dry Creek conveyance outlet will be pumped to Dry Creek at or near the point of diversion. Chapman and Hatfield (2021) conducted Fisheries Habitat Assessment Procedure (FHAP) surveys and mapping in the Fording River and a perrenial tributary to Dry Creek (T5) in 2021 to supplement FHAP data collected in the mainstem of Dry Creek by Buchanan et al. (2017) and support the design and permitting for the project.
S. Cope (2020) have conducted three pass removal depletion electrofishing in the lower section of Dry Creek below crossing 62181 as part of the Upper Fording River Westslope Ctthroat Trout Population Monitoring Project in 2013, 2014, 2015, 2017 and 2019 with fish densities sampled ranging from 2.25 to 16.5 fish/100m2. Sampling was continued in 2020 along with redd surveys in the lower reach of the stream with results presented in Thorley, Kortello, and Robinson (2021). Analysis by Thorley, Kortello, and Robinson (2021) indicates that there was a substantial decline in the number of adult westslope cutthroat trout in the Upper Fording River between 2017 and 2019 with no evidence of further decline between 2019 and 2020 suggesting the mortality may have been due to a short-term event opposed to chronic conditions.
In 2014, PSCIS stream crossings 62181 and 62182 were the sites of habitat confirmation assessments by Masse Environmental Consultants Ltd. (2015). The crossings were subjectively assessed as passable during the field assessments due to the low gradients and embeddedness of the pipes with the crossings not recommended for replacement at that time. Masse Environmental Consultants Ltd. (2015) did however recommend reassessment of the sites every 5 to 10 years due to likely substrate movement at the crossing locations. Upon review of this background reporting, and due to the likely presence of significant quantities of upstream habitat suitable for WCT rearing and spawning based on bcfishpass outputs, the Canadian Wildlife Federation assigned these sites as high priorities for follow up (Table 5.6). A map of the watershed is provided in map attachment 082J.103.
print_tab_summary_bcfp()| Habitat | Potential | Remediation Gain | Remediation Gain (%) |
|---|---|---|---|
| WCT Spawning (km) | 4.4 | 4.3 | 98 |
| WCT Rearing (km) | 5.4 | 4.5 | 83 |
| WCT Stream (km) | 15.9 | 5.9 | 37 |
| WCT Network (km) | 15.9 | 5.9 | 37 |
| WCT Lake Reservoir (ha) | – | 0.0 | – |
| WCT Wetland (ha) | – | 0.0 | – |
| WCT Slopeclass03 Waterbodies (km) | 0.0 | 0.0 | – |
| WCT Slopeclass03 (km) | 1.6 | 1.6 | 100 |
| WCT Slopeclass05 (km) | 3.0 | 2.9 | 97 |
| WCT Slopeclass08 (km) | 2.8 | 0.6 | 21 |
| WCT Slopeclass15 (km) | 7.1 | 0.6 | 8 |
| WCT Slopeclass22 (km) | 1.3 | 0.4 | 31 |
| * Model data is preliminary and subject to adjustments. | |||
| † Modelled rearing habitat estimates do not currently include linear lengths of centrelines within lakes and wetlands. |
Permit 107517, issued to Teck in November 2014 under provisions of the Environmental Management Act required development of a Tributary Management Plan for tributaries to the Elk and Fording Rivers that will incorporate protection and rehabilitation goals for tributaries to support achieving the area-based objectives of the Elk Valley Water Quality Plan (Teck Coal Limited 2020; Teck Resources Limited 2014). As part of the Tributary Management Plan, design work for fish passage improvement at the Highway and Railway is scheduled for 2021-2022 based on pre-construction data that was scheduled to be collected in 2021. Construction of restoration works has been slated for 2023 based on progress of a partnership and agreement on design between the Ministry of Transportation and Infrastructure, CP Railway and Teck (Teck Coal Limited 2020).
Stream Characteristics at Crossings
At the time of the survey, the PSCIS crossing 62181 was embedded, non-backwatered and considered a potential barrier to upstream fish passage according to the provincial metric. The pipes were 1.8m each in diameter with lengths of 17m, culvert slopes of 2.6%, a stream width ratio of 2.1 and an outlet drop of 0m (Table 5.7). Water temperature was 5\(^\circ\)C, pH was 8.2 and conductivity was 810uS/cm.
my_pscis_info_out %>% pull(assessment_comment)PSCIS crossing 62182 was comprised of two pipes. As per the provincial methodology, only data from the pipe with the lowest outlet elevation was entered into the provincial database (MoE 2011b). Although the lower of the two 1.8m diameter pipes was embedded for the majority of its length, it was not embedded near the inlet and there was a significantly sized inlet drop present (0.4m). The crossing was non-backwatered and considered a barrier to upstream fish passage according to the provincial metric. The pipe lengths were 17m, with the lower elevation pipe slope measured at 2.6%. The stream width ratio was 2.1 and the outlet drop was 0m (Table 5.8).
##this is useful to get some comments for the report
hab_site %>% filter(site == my_site2 & location == 'ds') %>% pull(comments)
my_priority <-  my_priority_info()
Stream Characteristics Downstream
The stream was surveyed downstream from 62182 for 500m (Figures 5.7 - 5.8). Overall, total cover amount was rated as abundant with undercut banks dominant. Cover was also present as deep pools and overhanging vegetation (Table 5.9). The average channel width was 3.9m, the average wetted width was 3.1m and the average gradient was 2%. The dominant substrate was cobbles with gravels subdominant. During the downstream survey the stream was observed to be quite open for the first with all riparian vegetation comprised as shrub before transitioning into mature mixed forest at approximately 225m downstream of the crossing where a climate and hydrometric station was observed. Pools and undercut banks were noted with their frequency increasing further downstream. The stream was documented as braided at times and had appeared to have shifted into a new channel, indicated by fine substrate, mid stream standing/dead conifers and no major channel development (ie. wetted channel was equivalent to channel width in these areas). Substrate was observed well outside the normal high water mark suggesting high flows and channel movement. Sharp bends in the stream resulted in deep pools and undercut banks. Habitat value was rated as high.
Stream Characteristics Upstream
# as a note - we are using my_sit = my_site2 because the detailed info was recorded on that cardThe stream was surveyed upstream from 62181 for 650m (Figures 5.9 - 5.10). Environmental monitoring system sample location E288270 (EQuiS: LC_DC1) was located approximately 100m upstream of the railway at the bridge on the Fording FSR. In the area surveyed, total cover amount was rated as abundant with undercut banks dominant. Cover was also present as small woody debris, large woody debris, boulders, deep pools, and overhanging vegetation (Table 5.9). The average channel width was 4.1m, the average wetted width was 3m and the average gradient was 3.3%. Habitat value was rated as high for salmonid rearing and spawning due to good flow, larger channel size, occasional pockets of gravel and the presence of intermittent pools.
Structure Remediation and Cost Estimate
Structure replacement with a bridge (12m span) is recommended to provide access to the habitat located upstream of PSCIS crossing 62181. The cost of the work is estimated at $7,200,000 for a cost benefit of 0.6 linear m/$1000 and 2.4m2/$1000.
Conclusion
There is an estimated 4.3km of mainstem habitat upstream of crossing 62181 to the LCODCWMS headpond. Habitat in the area surveyed was rated as high value for salmonid rearing/spawning. The railway is the responsibility of Canadian Pacific Rail and the highway appears to be the responsibility of the Ministry of Transportation and Infrastructure. The crossing was ranked as a high priority for proceeding to design for replacement. Line Creek watershed is within Phase II of Teck Coal Limited’s – Line Creek Operation area with a wealth of past and current information regarding the stream available including detailed habitat assessment, water quality, benthic invertebrate, toxicity and flow data gathered through the ongoing Line Creek Operations Local Aquatic Effects Monitoring Program. At the time of reporting, the Dry Creek Water Conveyance and Supplementation Project was under construction and fish passage restoration works at the highway and railway were planned for 2023 through Teck’s Tributary Management Plan and based on progress of a potential partnership and agreement on design between the Ministry of Transportation and Infrastructure, CP Railway and Teck (Burns et al. 2021; Chapman and Hatfield 2021; Teck Coal Limited 2020).
print_tab_summary()| Location and Stream Data |
|
Crossing Characteristics | – |
|---|---|---|---|
| Date | 2021-09-29 | Crossing Sub Type | Round Culvert |
| PSCIS ID | 62181 | Diameter (m) | 1.8 |
| External ID | – | Length (m) | 17 |
| Crew | KP | Embedded | Yes |
| UTM Zone | 11 | Depth Embedded (m) | 0.35 |
| Easting | 656409 | Resemble Channel | Yes |
| Northing | 5544755 | Backwatered | No |
| Stream | Dry Creek | Percent Backwatered | – |
| Road | CP Railway | Fill Depth (m) | 1.2 |
| Road Tenure | Canadian Pacific | Outlet Drop (m) | 0 |
| Channel Width (m) | 3.7 | Outlet Pool Depth (m) | 0 |
| Stream Slope (%) | 3.3 | Inlet Drop | Yes |
| Beaver Activity | No | Slope (%) | 2.6 |
| Habitat Value | Medium | Valley Fill | Deep Fill |
| Final score | 19 | Barrier Result | Potential |
| Fix type | Replace with New Open Bottom Structure | Fix Span / Diameter | 12 |
Photos: From top left clockwise: Road/Site Card, Barrel, Outlet, Downstream, Upstream, Inlet.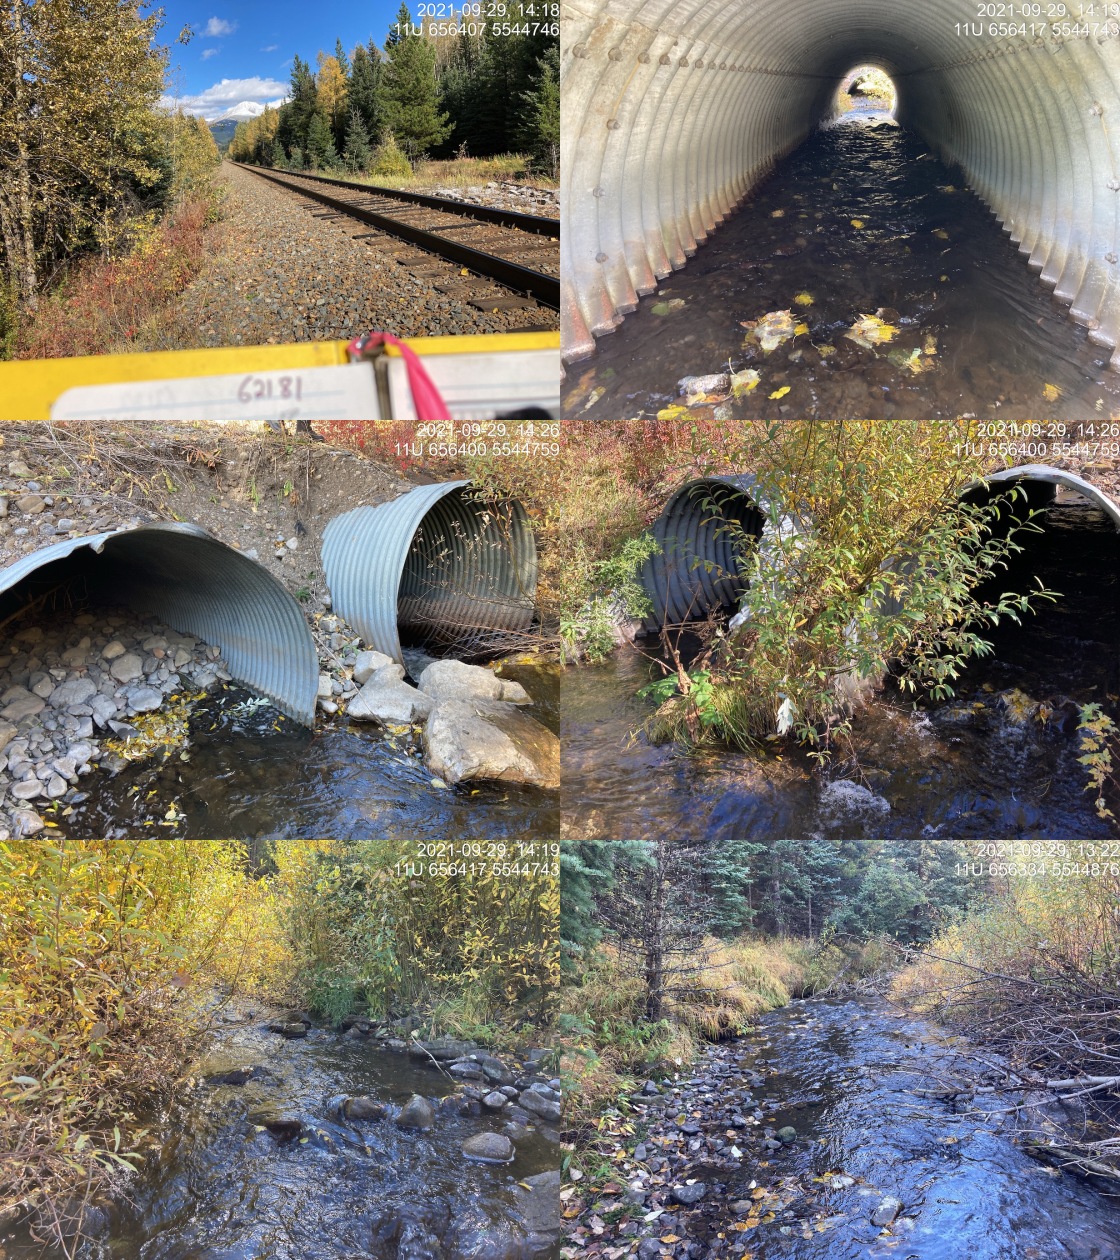
|
|||
| Comments: Two pipes (1.8m x 1.8m). Left pipe was measured. Right pipe gradient ~3%. Right pipe partially embedded. 14:16 |
print_tab_summary(site = my_site2, site_photo_id = my_site2)| Location and Stream Data |
|
Crossing Characteristics | – |
|---|---|---|---|
| Date | 2021-09-29 | Crossing Sub Type | Round Culvert |
| PSCIS ID | 62182 | Diameter (m) | 1.8 |
| External ID | – | Length (m) | 24 |
| Crew | KP | Embedded | No |
| UTM Zone | 11 | Depth Embedded (m) | – |
| Easting | 656390 | Resemble Channel | No |
| Northing | 5544771 | Backwatered | No |
| Stream | Dry Creek | Percent Backwatered | – |
| Road | Fording Highway | Fill Depth (m) | 1.8 |
| Road Tenure | Elkford Local | Outlet Drop (m) | 0 |
| Channel Width (m) | 3.7 | Outlet Pool Depth (m) | 0 |
| Stream Slope (%) | 3.3 | Inlet Drop | Yes |
| Beaver Activity | No | Slope (%) | 3.6 |
| Habitat Value | Medium | Valley Fill | Deep Fill |
| Final score | 29 | Barrier Result | Barrier |
| Fix type | Replace with New Open Bottom Structure | Fix Span / Diameter | 12 |
Photos: From top left clockwise: Road/Site Card, Barrel, Outlet, Downstream, Upstream, Inlet.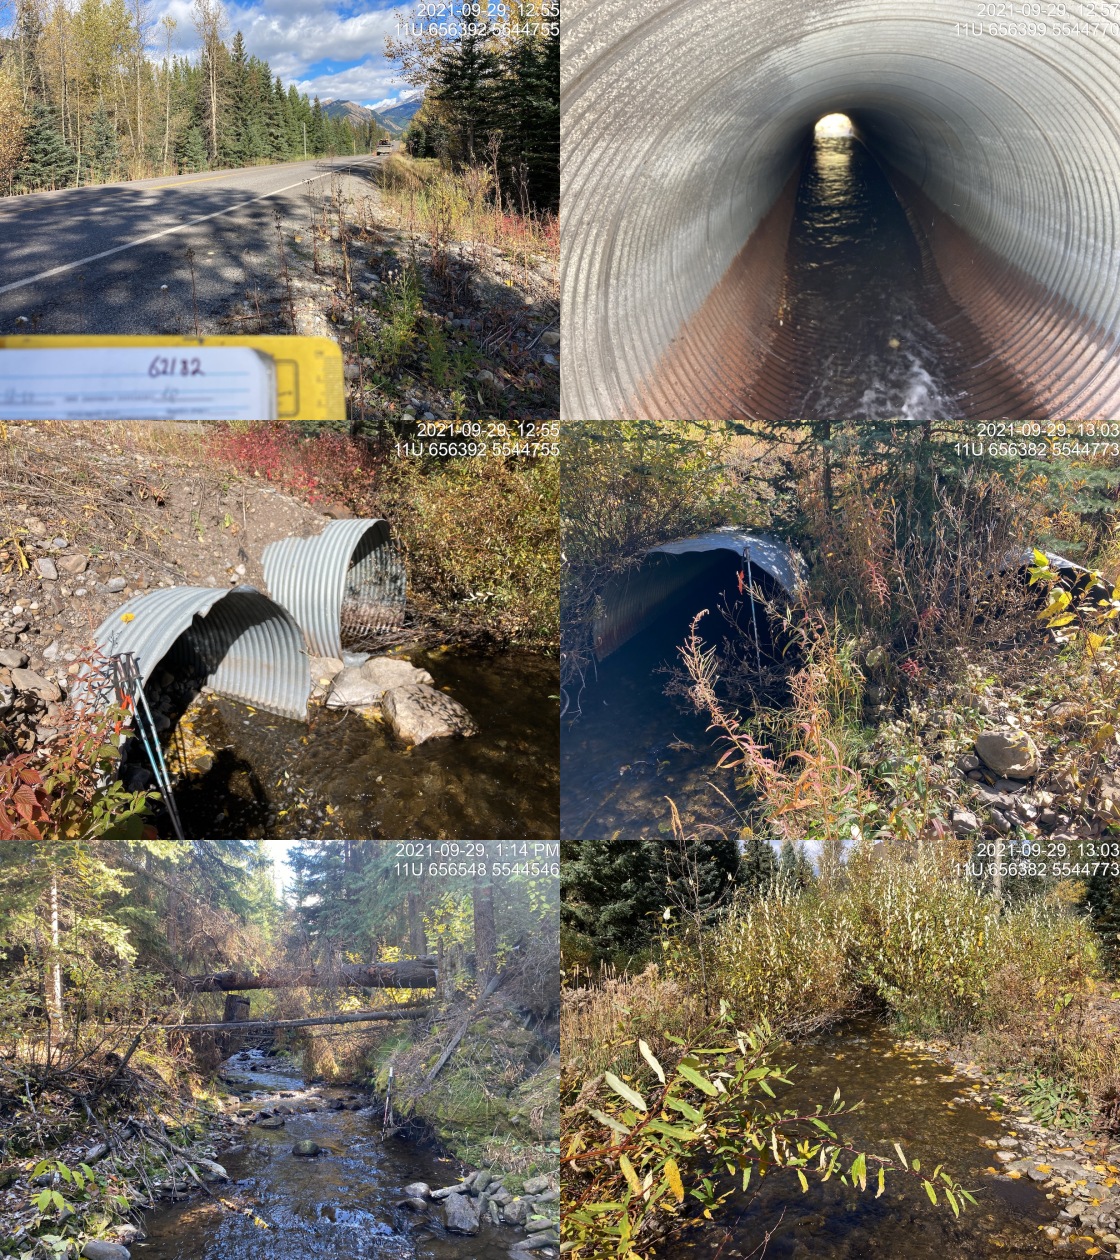
|
|||
| Comments: Two pipes (1.8m x 1.8m). Stream left pipe embedd at outlet 0.6m but not at inlet and there is a significant inlet drop. PSCIS crossing 62182 is located ~30m upstream of the crossing under the railway. 12:50 |
tab_hab_summary %>%
  filter(Site  == my_site2) %>%
  # select(-Site) %>%
my_kable(caption_text = paste0('Summary of habitat details for PSCIS crossings ', my_site, ' and ', my_site2, '.'))| Site | Location | Length Surveyed (m) | Channel Width (m) | Wetted Width (m) | Pool Depth (m) | Gradient (%) | Total Cover | Habitat Value |
|---|---|---|---|---|---|---|---|---|
| 62182 | Upstream | 30 | 4.1 | 3.0 | 0.3 | 3.3 | abundant | high |
| 62182 | Downstream | 500 | 3.9 | 3.1 | 0.4 | 2.0 | abundant | high |
my_photo1 = pull_photo_by_str(site_id = my_site2, str_to_pull = '_d1_')

my_caption1 = paste0('Typical habitat downstream of PSCIS crossing ', my_site2, '.')grid::grid.raster(get_img(site = my_site2, photo = my_photo1))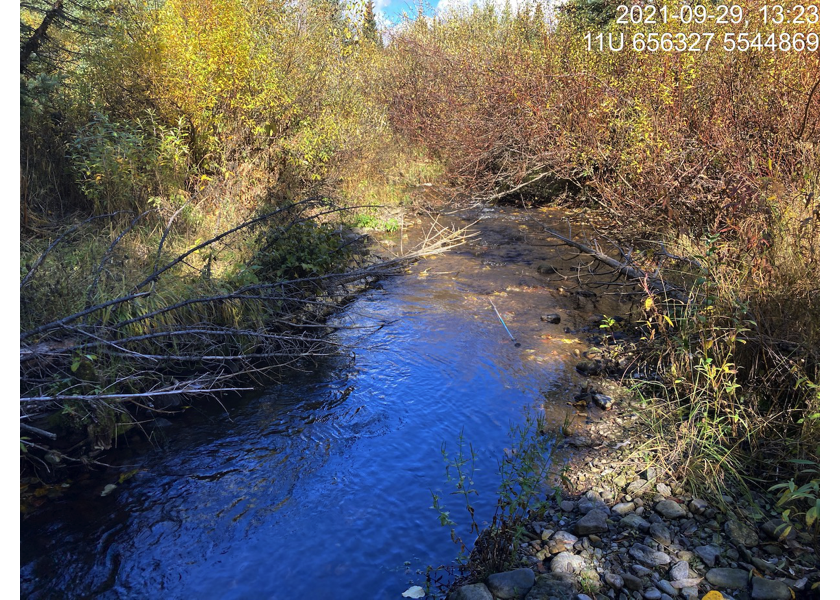
Figure 5.7: Typical habitat downstream of PSCIS crossing 62182.
my_photo2 = pull_photo_by_str(site_id = my_site2, str_to_pull = '_d2_')

my_caption2 = paste0('Typical habitat downstream of PSCIS crossing ', my_site2, '.')grid::grid.raster(get_img(site = my_site2, photo = my_photo2))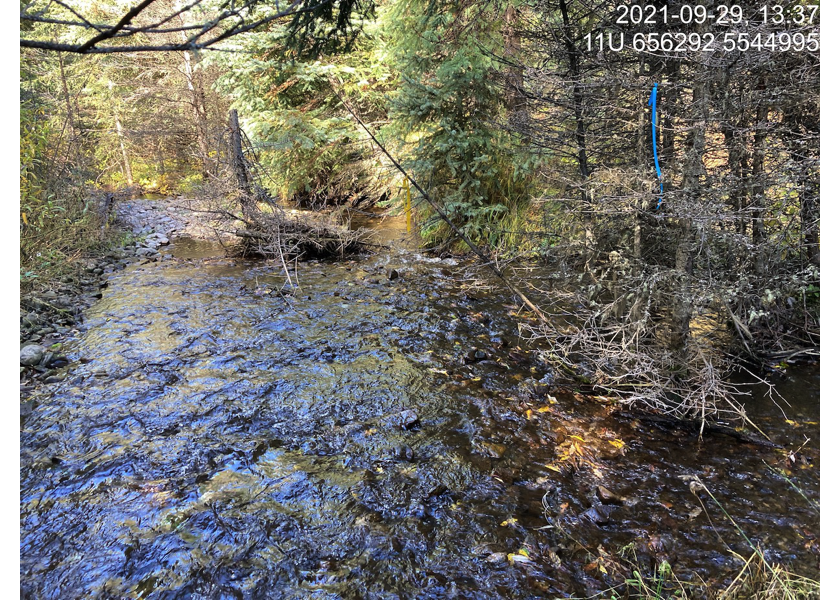
Figure 5.8: Typical habitat downstream of PSCIS crossing 62182.
##we could put 2 photos in on box but it is lots of extra work with the crossreferences. pdfs suck anyway.  Don't get too custom with it!!!

# my_photo1 = pull_photo_by_str(str_to_pull = '_d1_')
# my_caption1 = paste0('Typical habitat downstream of PSCIS crossing ', my_site, '.')
#
# my_photo2 = pull_photo_by_str(str_to_pull = '_u1_')
# my_caption2 = paste0('Typical habitat upstream of PSCIS crossing ', my_site, '.')

my_caption <- paste0('Left: ', my_caption1, ' Right: ', my_caption2)

knitr::include_graphics(get_img_path(site = my_site2, photo = my_photo1))
knitr::include_graphics("fig/pixel.png")
knitr::include_graphics(get_img_path(site = my_site2, photo = my_photo2))
my_photo1 = pull_photo_by_str(str_to_pull = '_u1_')
my_caption1 = paste0('Typical habitat upstream of PSCIS crossing ', my_site, '.')grid::grid.raster(get_img(photo = my_photo1))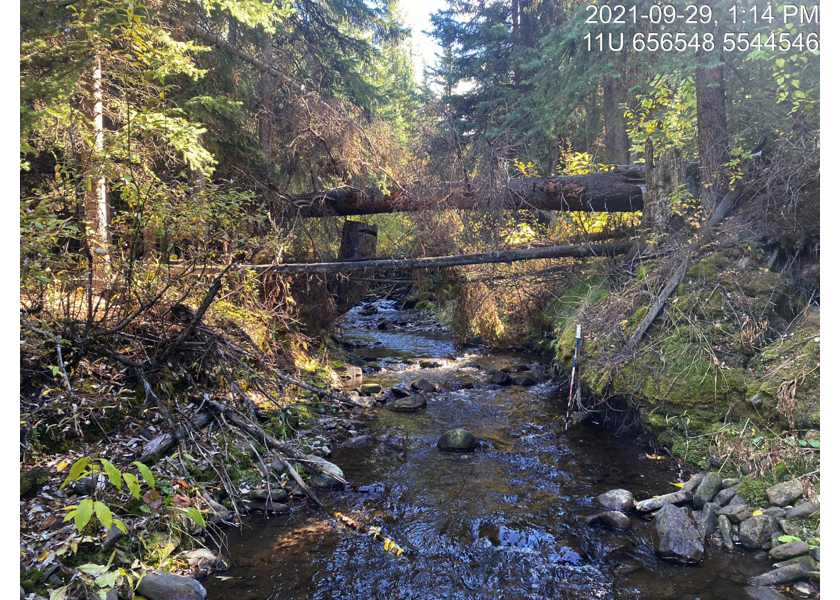
Figure 5.9: Typical habitat upstream of PSCIS crossing 62181.
my_photo2 = pull_photo_by_str(str_to_pull = '_u2_')

my_caption2 = paste0('Typical habitat upstream of PSCIS crossing ', my_site, '.')grid::grid.raster(get_img(photo = my_photo2))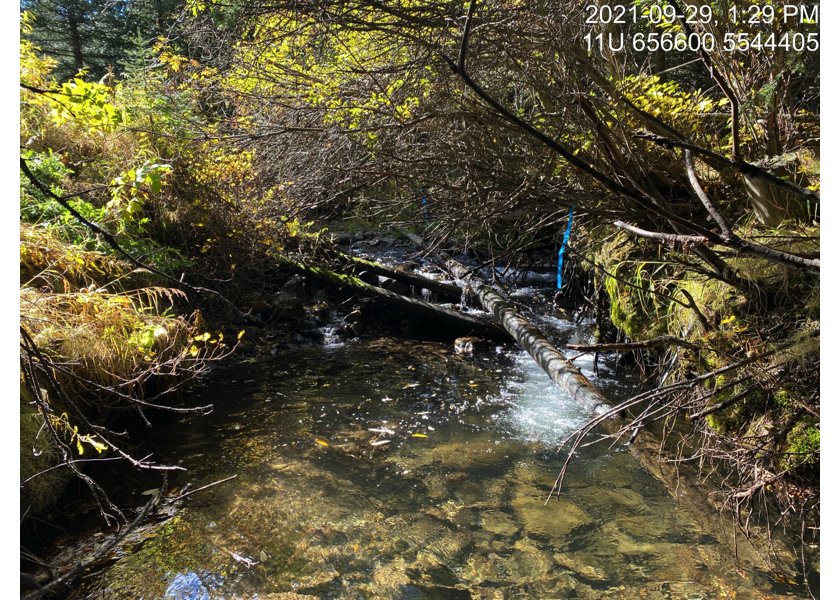
Figure 5.10: Typical habitat upstream of PSCIS crossing 62181.
my_caption <- paste0('Left: ', my_caption1, ' Right: ', my_caption2)

knitr::include_graphics(get_img_path(photo = my_photo1))
knitr::include_graphics("fig/pixel.png")
knitr::include_graphics(get_img_path(photo = my_photo2))knitr::opts_chunk$set(echo=FALSE, message=FALSE, warning=FALSE)
source('R/packages.R')
source('R/functions.R')
source('R/tables.R')my_site <- 62505