Tributary to the Table River - 125231 - Appendix
Site Location
PSCIS crossing 125231 is located on a tributary to the Table River near the 21km mark of the Chuchinka-Table FSR. The culverts are located 0.7km from the confluence of the Table River and approximately 200m upstream of a CN Railway culvert (PSCIS 197493 - discussed below). Canfor Forest Products Ltd. are the primary forest licensee at this location with the Ministry of Forests as the road tenure holder.
Background
The site was originally prioritized for replacement in A. Irvine (2020), following a habitat confirmation assessment which can be found here. Follow up work was conducted in the summer of 2023 which included fish sampling and tagging with pit tags. In the summer of 2024, crossing 125231 was replaced with a 12m steel girder/timber deck clear-span bridge by Canfor with environmental oversight and engineering from DWB Consulting Services Ltd. Site design plans can be found here with a construction monitoring report here (DWB Consulting Services Ltd. 2024). Partial funding for the project was provided by FWCP through coordination from SERNbc. During fish salvage activities prior to construction DWB scanned captured fish for PIT tags. Additionally, following replacement of the structure SERNbc and McLeod Lake field crews revisited the site to conduct follow up sampling and effectiveness monitoring. This memo has been updated to reflect the work conducted in 2024.
The subject stream flows in a southern direction into the Table River at a point 7.9 km upstream from the confluence with the Parsnip River. At crossing 125231, the tributary to the Table River is a third order stream with a watershed area upstream of the crossing of approximately 4km2. The elevation of the watershed ranges from a maximum of 1605m to 754m at the crossing (Table 5.1).
PSCIS crossing 197493 is located on the CN Railway approximately 200m downstream of the Chuckinka-Table FSR where replacement of PSCIS crossing 125231 is planned. At the time of assessments conducted in both 2019 and 2022, the fully embedded railway culvert was considered passable according to provincial metrics (MoE 2011). A recently installed bridge (PSCIS 197499) is located approximately 450m upstream of the crossing and there are no other anthropogenic obstructions to fish passage upstream.
Upstream of crossing 125231, rainbow trout have previously been recorded (Norris [2018] 2024; MoE 2024) and DWB reporting captured of a bull trout just downstream of the crossing during salvage activities. A summary of habitat modelling outputs is presented in Table 5.2. A map of the watershed is provided in map attachment 093J.120.
fpr::fpr_table_wshd_sum(site_id = my_site) |>
  fpr::fpr_kable(caption_text = paste0('Summary of derived upstream watershed statistics for PSCIS crossing ', my_site, '.'),
           footnote_text = 'Elev P60 = Elevation at which 60% of the watershed area is above',
scroll = F)| Site | Area Km | Elev Site | Elev Max | Elev Median | Elev P60 | Aspect |
|---|---|---|---|---|---|---|
| 125231 | 4 | 754 | 1605 | 1183 | 1115 | SSE |
| * Elev P60 = Elevation at which 60% of the watershed area is above |
| Habitat | Potential | Remediation Gain | Remediation Gain (%) |
|---|---|---|---|
| BT Rearing (km) | 0.4 | 0.4 | 100 |
| BT Spawning (km) | 0.1 | 0.1 | 100 |
| BT Network (km) | 3.4 | 3.3 | 97 |
| BT Stream (km) | 3.4 | 3.3 | 97 |
| BT Lake Reservoir (ha) | 0.0 | 0.0 | – |
| BT Wetland (ha) | 0.0 | 0.0 | – |
| BT Slopeclass03 (km) | 0.0 | 0.0 | – |
| BT Slopeclass05 (km) | 0.1 | 0.1 | 100 |
| BT Slopeclass08 (km) | 0.4 | 0.4 | 100 |
| BT Slopeclass15 (km) | 2.2 | 2.1 | 95 |
| * Model data is preliminary and subject to adjustments. |
Effectiveness Monitoring
In September 2024, effectiveness monitoring was conducted at the site, with results summarised in Table 5.3. Overall, assessments indicate that the structure was well-designed to fit the stream channel, with minimal rock placement within the natural channel and un-constricted flows. The structure appeared stable with no maintenance required at the time of reporting. Recommendations to be implemented at future remediation sites include the planting of nursery grown and salvaged vegetation within the construction footprint where riparian vegetation was removed to accommodate construction. Photos showing a comparison of the culvert assessment conducted in 2020 versus the completed bridge construction in 2024 are presented in the 2020 report and in Figure 5.11.
Aerial imagery surveys were conducted with a remotely piloted aircraft and the resulting images were stitched into orthomosaics. Imagery from before the bridge replacement in 2023 is presented in Figures 5.1 - 5.2, and after the replacement in 2024 is presented in Figures 5.3 - 5.4.
tab_monitoring |>
  dplyr::filter(`Pscis Crossing Id` == my_site) |>
  dplyr::mutate(across(everything(), as.character)) |>
  tidyr::pivot_longer(
    cols = everything(),  # Select all columns
    names_to = "variable",  # Column names become values in this column
    values_to = "value"  # Data values go into this column
  ) |>
  fpr::fpr_kable(caption_text = paste0('Summary of monitoring metric results for PSCIS crossing ', my_site, '.'),
scroll = gitbook_on)| variable | value |
|---|---|
| Pscis Crossing Id | 125231 |
| Stream Name | Tributary to Table River |
| Road Name | Chuchinka-Table FSR |
| Crossing Subtype | BRIDGE |
| Span | 12.2 |
| Width | 4.9 |
| Assessment Comment | The crossing was replaced with a clear-span bridge by Canfor with environmental oversight and engineering from DWB Consulting Services Ltd. Partial funding for the project was provided by FWCP through coordination from SERNbc. The structure was well-designed to fit the stream channel, with minimal rock placement in areas likely to be within the natural channel and without constricting flow. In future projects, the use of vegetated riprap is recommended, and vegetation removed from the construction footprint should be reinstalled within the disturbed area. |
| Dewatering Notes | No dewatering |
| Velocity Notes | Construction footprint has a similar gradient and velocity to upstream and downstream. |
| Constriction Notes | The channel width measured within the construction footprint was larger than those measured upstream and downstream, with recorded widths of 4.6m, 4.4m, and 4.0m. The channel was well constructed. |
| Substrate Notes | The substrate was similar to upstream and downstream, consisting primarily of gravels with some cobbles and riprap boulders placed within the stream to provide velocity breaks and habitat. Fine sediment was present along the edges where the pipes were before construction, which will likely disperse downstream over time. Leaving it in place did not seem unreasonable. |
| Riparian Notes | There appeared to be no planting of riparian vegetation within the construction footprint, and no salvaged material had been replanted elsewhere. |
| Flow Depth Notes | Flow depths were shallow, primarily ranging from 2–25cm. Additional placement of larger rock with stone lines could create deeper sections; however, this may occur naturally over time. |
| Stability Notes | Structure appears well built and perfectly stable. |
| Revegetation Notes | No re-vegetation activities appeared to have occurred, and no salvaged plant material was observed throughout the site. For future projects, it is recommended that shrubs removed from the construction footprint be stockpiled and later placed on top of riprap with finer material to encourage re-vegetation, providing cover and food inputs. |
| Cover Notes | Riprap boulders were placed intermittently throughout the stream channel, presumably to provide velocity breaks and potential cover through undercutting over time. However, there was currently very little cover within the entire bridge construction footprint. Future projects should incorporate vegetated riprap and re-vegetation efforts to enhance habitat quality. |
| Maintenance Notes | No maintenance requirements at this time. |
model_url <- '<iframe src="https://www.mapsmadeeasy.com/maps/public/ae73e230851242d882c5cd77fec97635" scrolling="no" title="Maps Made Easy" width="100%" height="600" frameBorder ="0"></iframe>'

knitr::asis_output(model_url)
my_photo = 'fig/pixel.png'
my_caption = paste0('Orthomosaic of PSCIS crossing 125231 before replacement.')
knitr::include_graphics(my_photo, dpi = NA)Figure 5.1: Orthomosaic of PSCIS crossing 125231 before replacement.
model_url <- '<iframe src="https://www.mapsmadeeasy.com/maps/public_3D/ae73e230851242d882c5cd77fec97635" scrolling="no" title="Maps Made Easy" width="100%" height="500" frameBorder ="0"></iframe>'

knitr::asis_output(model_url)
my_photo = 'fig/pixel.png'
my_caption = paste0('3D model of PSCIS crossing 125231 before replacement.')
knitr::include_graphics(my_photo, dpi = NA)Figure 5.2: 3D model of PSCIS crossing 125231 before replacement.
model_url <- '<iframe src="https://www.mapsmadeeasy.com/maps/public/9e0ad93052dc4f05bf1012c760151377" scrolling="no" title="Maps Made Easy" width="100%" height="600" frameBorder ="0"></iframe>'

knitr::asis_output(model_url)
my_photo = 'fig/pixel.png'
my_caption = paste0('Orthomosaic of PSCIS crossing 125231 after replacement.')
knitr::include_graphics(my_photo, dpi = NA)Figure 5.3: Orthomosaic of PSCIS crossing 125231 after replacement.
model_url <- '<iframe src="https://www.mapsmadeeasy.com/maps/public_3D/9e0ad93052dc4f05bf1012c760151377/" scrolling="no" title="Maps Made Easy" width="100%" height="500" frameBorder ="0"></iframe>'

knitr::asis_output(model_url)
my_photo = 'fig/pixel.png'
my_caption = paste0('3D model of PSCIS crossing 125231 after replacement.')
knitr::include_graphics(my_photo, dpi = NA)Figure 5.4: 3D model of PSCIS crossing 125231 after replacement.
Fish Sampling
Fish sampling was conducted in 2023 before the crossing was replaced, during the pre-construction salvage (by DWB) and in 2024 after the bridge was constructed.
In 2023, a total six sites were sampled in the vicinity of crossing 125231 with three sites located upstream and three sites located downstream of the Chuckinka-Table FSR. Electrofishing results are summarised in Tables 5.4 - 5.5 and Figure 5.5. A total of 59 rainbow trout were captured upstream, and 27 rainbow trout were captured downstream (Figure 5.9). All fish captured with a fork length greater than 60mm were tagged with Passive Integrated Transponders (PIT tags) with data stored here.
A PIT tag reader was loaned to DWB during the 2024 pre-construction salvage so that fish captured could be scanned to track health and movement of fish captured during 2023 sampling. Although a total of 23 rainbow trout and one bull trout were caught, no previously tagged fish were captured. Of interest, the capture of a bull trout downstream of the crossing - is a first for the study stream’s watershed and evidence that remediation activities are likely to benefit this species (DWB Consulting Services Ltd. 2024).
In 2024, electrofishing was conducted at two sites downstream and one site upstream of the Chuckinka-Table FSR. No fish captured had a PIT tag, therefore no fish from 2023 were recaptured. Electrofishing results are summarised in Tables 5.6 - 5.7 and Figure 5.6. A total of 11 rainbow trout were captured upstream, and 17 rainbow trout were captured downstream (Figure 5.10). All fish captured with a fork length greater than 60mm were tagged with Passive Integrated Transponders (PIT tags) with data stored here.
Conclusion
PSCIS crossing 125231 on the Chuchinka-Table FSR offered a relatively rare opportunity in the Table River watershed to remediate fish passage on a forest service road, due to the downstream PSCIS crossing 197493 being fully embedded and passable in both 2019 and 2022, and passage was not also impeded by a CN Railway structure. Although the stream is smaller in size, it is located within an area designated as a fisheries sensitive watershed with habitat presence suitable for bull trout (Western Arctic population) which has been assessed by the Committee on the Status of Endangered Wildlife in Canada as a species of special concern and now confirmed as present within the subject stream (P. Beaudry 2014; COSEWIC 2012b; DWB Consulting Services Ltd. 2024).
Resampling of fish at crossing 125231 in the future is recommended to build our understanding of fish use, movement and health in the stream. eDNA could be considered as a method to detect bull trout presence upstream of the crossing. Additionally, future acquisition of aerial imagery or lidar is recommended so that a time series of imagery and 3D models generated from the data can be compared. These comparisons will be useful - not only for communications related to the project - but also for providing insight into changes in stream morphology and vegetation changes following construction.
The installation of a clear-span bridge - partially funded by FWCP - appears to have been very well implemented by Canfor and DWB. Remediation of the site provides access to valuable habitat previously blocked to upstream migrating fish.
| site | passes | ef_length_m | ef_width_m | area_m2 | enclosure |
|---|---|---|---|---|---|
| 125231_ds_ef1 | 1 | 10 | 1.6 | 16.0 | open |
| 125231_ds_ef2 | 1 | 12 | 2.6 | 31.2 | open |
| 125231_ds_ef3 | 1 | 17 | 2.2 | 37.4 | open |
| 125231_us_ef1 | 1 | 15 | 1.9 | 28.5 | open |
| 125231_us_ef2 | 1 | 19 | 1.9 | 36.1 | open |
| 125231_us_ef3 | 1 | 29 | 1.7 | 49.3 | open |
| local_name | species_code | life_stage | catch | density_100m2 | nfc_pass |
|---|---|---|---|---|---|
| 125231_ds_ef1 | RB | fry | 8 | 50.0 | FALSE |
| 125231_ds_ef1 | RB | parr | 2 | 12.5 | FALSE |
| 125231_ds_ef2 | RB | fry | 10 | 32.1 | FALSE |
| 125231_ds_ef2 | RB | parr | 1 | 3.2 | FALSE |
| 125231_ds_ef3 | RB | fry | 5 | 13.4 | FALSE |
| 125231_ds_ef3 | RB | parr | 1 | 2.7 | FALSE |
| 125231_us_ef1 | RB | fry | 14 | 49.1 | FALSE |
| 125231_us_ef2 | RB | fry | 10 | 27.7 | FALSE |
| 125231_us_ef2 | RB | adult | 1 | 2.8 | FALSE |
| 125231_us_ef3 | RB | fry | 34 | 69.0 | FALSE |
|
* nfc_pass FALSE means fish were captured in final pass indicating more fish of this species/lifestage may have remained in site. Mark-recaptured required to reduce uncertainties. |
my_caption <- paste0('Densites of fish (fish/100m2) captured upstream and downstream of PSCIS crossing ', my_site, '.')


fish_abund |>
  dplyr::filter(site == my_site & species_code != "NFC")  |>
  ggplot(aes(x = location, y = density_100m2)) +
  geom_boxplot() +
  facet_grid(species_code ~ life_stage, scales = "fixed",
             as.table = T) +
  theme(legend.position = "none",
        axis.title.x = element_blank()) +
  geom_dotplot(binaxis = "y",
               stackdir = "center", dotsize = 1) +
  ylab(expression(Density ~
                    (fish/100 ~ m^2)))+
  cowplot::theme_minimal_hgrid() +
  cowplot::panel_border()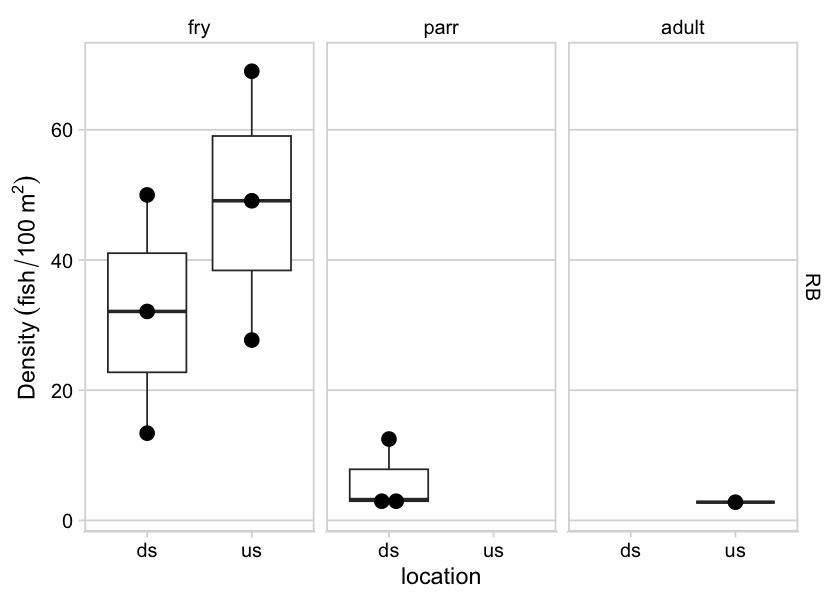
Figure 5.5: Densites of fish (fish/100m2) captured upstream and downstream of PSCIS crossing 125231.
tab_fish_sites_sum_2024 %>%
  tidyr::separate(site, into = c("site_id", "location",
        "ef"), remove = F) |>
  dplyr::filter(site_id == my_site) |>
  dplyr::select(site, passes, ef_length_m, ef_width_m,
            area_m2, enclosure) |>
  fpr::fpr_kable(caption_text = paste0("Fish sampling site summary for ",
my_site, " in 2024."), scroll = F)| site | passes | ef_length_m | ef_width_m | area_m2 | enclosure |
|---|---|---|---|---|---|
| 125231_ds_ef1 | 1 | 40 | 2.1 | 84 | closed |
| 125231_us_ef1 | 1 | 70 | 3.0 | 210 | partial enclosure |
| 125231_ds_ef2 | 1 | 30 | 2.2 | 66 | partial enclosure |
fish_abund_2024|>
  dplyr::filter(site == my_site) |>
  dplyr::select(local_name, species_code, life_stage, catch, density_100m2, nfc_pass) |>
  fpr::fpr_kable(caption_text = paste0("Fish sampling density results summary for ",
            my_site, " in 2024."),
            footnote_text = "nfc_pass FALSE means fish were captured in final pass indicating more fish of this species/lifestage may have remained in site.\n              Mark-recaptured required to reduce uncertainties.",
scroll = F)| local_name | species_code | life_stage | catch | density_100m2 | nfc_pass |
|---|---|---|---|---|---|
| 125231_ds_ef1 | Rainbow Trout | fry | 5 | 6.0 | FALSE |
| 125231_ds_ef1 | Rainbow Trout | juvenile | 2 | 2.4 | FALSE |
| 125231_ds_ef1 | Rainbow Trout | parr | 2 | 2.4 | FALSE |
| 125231_ds_ef2 | Rainbow Trout | fry | 2 | 3.0 | FALSE |
| 125231_ds_ef2 | Rainbow Trout | parr | 6 | 9.1 | FALSE |
| 125231_us_ef1 | Rainbow Trout | fry | 2 | 1.0 | FALSE |
| 125231_us_ef1 | Rainbow Trout | juvenile | 2 | 1.0 | FALSE |
| 125231_us_ef1 | Rainbow Trout | parr | 7 | 3.3 | FALSE |
|
* nfc_pass FALSE means fish were captured in final pass indicating more fish of this species/lifestage may have remained in site. Mark-recaptured required to reduce uncertainties. |
my_caption <- paste0('Densites of fish (fish/100m2) captured upstream and downstream of PSCIS crossing ', my_site, ' in 2024.')

fpr::fpr_plot_fish_box(dat = fish_abund_2024) 
Figure 5.6: Densites of fish (fish/100m2) captured upstream and downstream of PSCIS crossing 125231 in 2024.
my_photo1 = fpr::fpr_photo_pull_by_str(str_to_pull = 'ds_ef2_typical2')

my_caption1 = paste0('Habitat electrofished downstream of PSCIS crossing ', my_site, ' in 2023.')
Figure 5.7: Habitat electrofished downstream of PSCIS crossing 125231 in 2023.
my_photo2 = fpr::fpr_photo_pull_by_str(str_to_pull = 'us_ef1_typical1')

my_caption2 = paste0('Habitat electrofished upstream of PSCIS crossing ', my_site, ' in 2023.')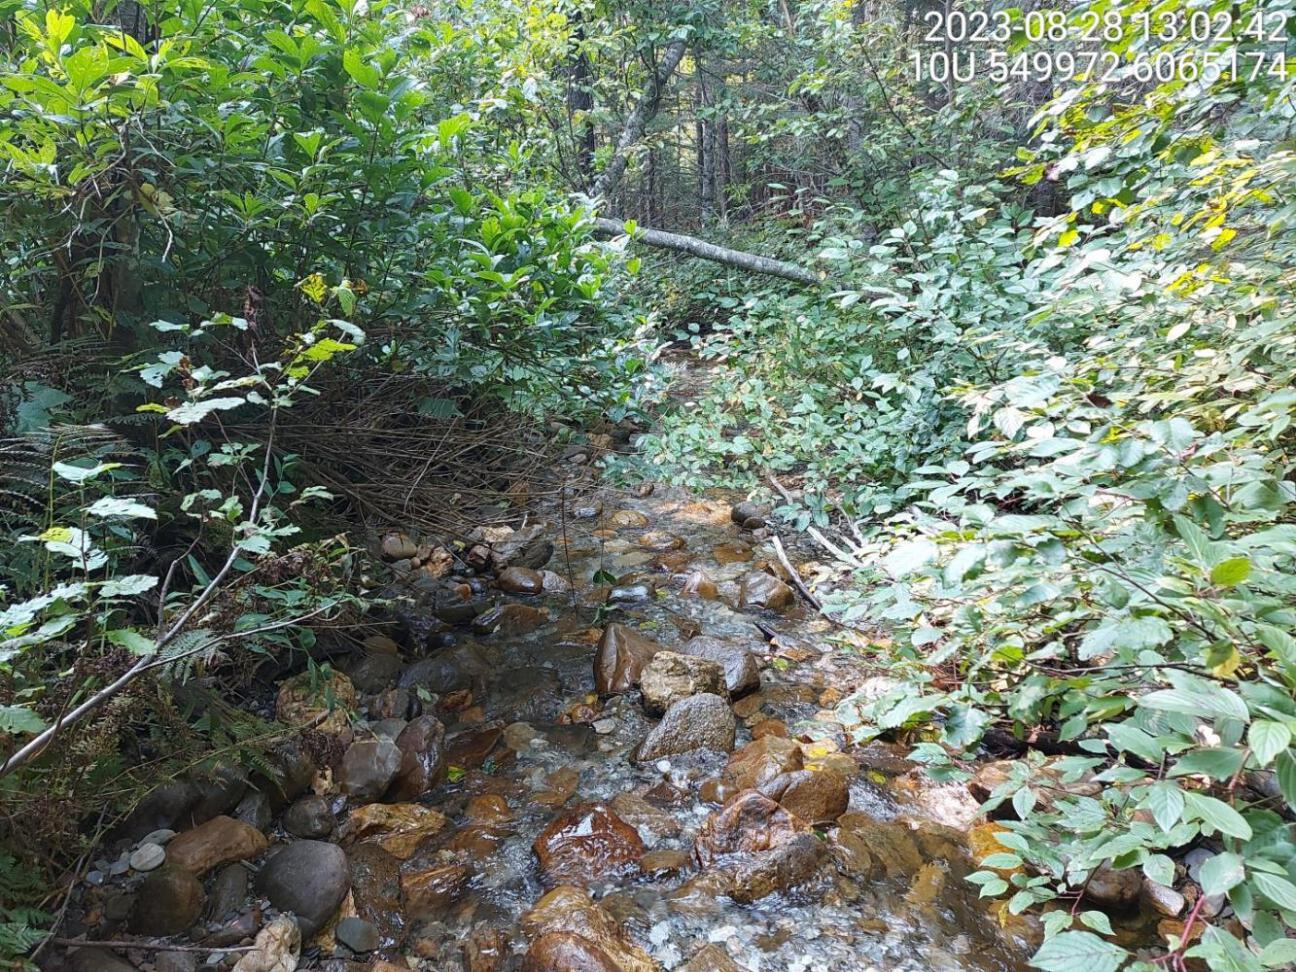
Figure 5.8: Habitat electrofished upstream of PSCIS crossing 125231 in 2023.
my_caption <- paste0('Left: ', my_caption1, ' Right: ', my_caption2)

knitr::include_graphics(my_photo1)
knitr::include_graphics("fig/pixel.png")
knitr::include_graphics(my_photo2)
my_photo1 = fpr::fpr_photo_pull_by_str(str_to_pull = 'rb2')
my_caption1 = paste0('Rainbow trout captured upstream of PSCIS crossing ', my_site, ' in 2023.')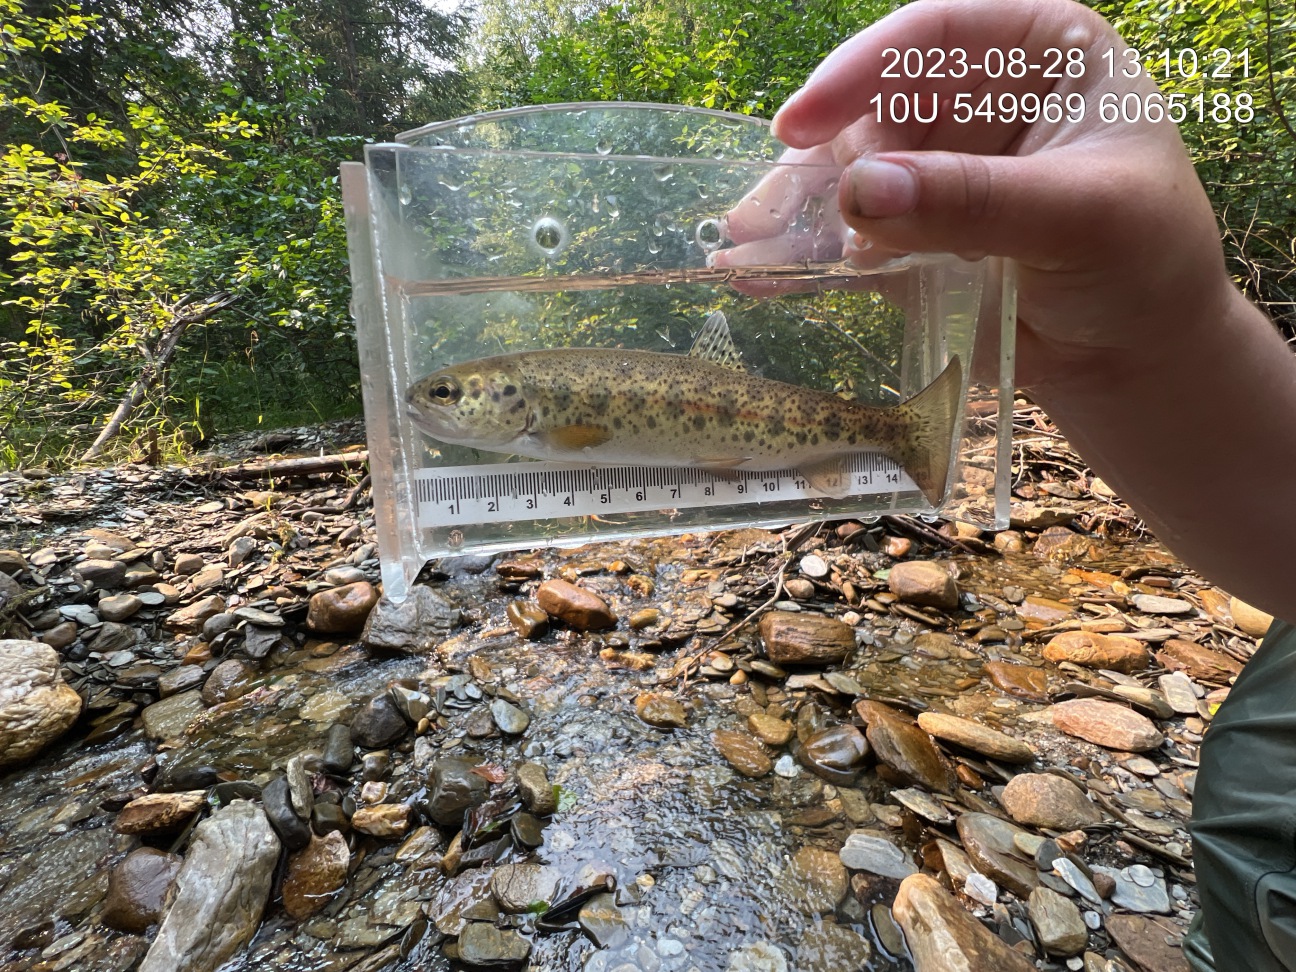
Figure 5.9: Rainbow trout captured upstream of PSCIS crossing 125231 in 2023.
my_photo2 = fpr::fpr_photo_pull_by_str(str_to_pull = 'fish3')

my_caption2 = paste0('Rainbow trout captured downstream of PSCIS crossing ', my_site, ' in 2024.')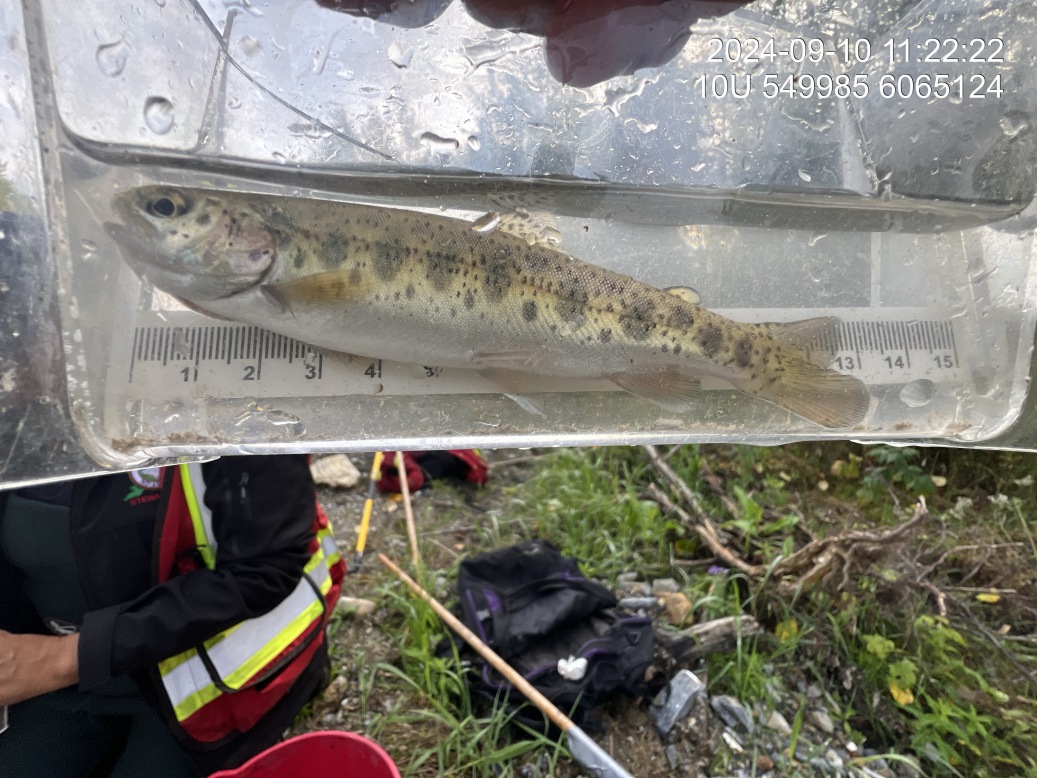
Figure 5.10: Rainbow trout captured downstream of PSCIS crossing 125231 in 2024.
my_caption <- paste0('Left: ', my_caption1, ' Right: ', my_caption2)

knitr::include_graphics(my_photo1)
knitr::include_graphics("fig/pixel.png")
knitr::include_graphics(my_photo2)
my_photo1 = fpr::fpr_photo_pull_by_str(str_to_pull = 'crossing_all_2024')
my_caption1 = paste0('Photos of crossing ', my_site, ' in 2024.')
Figure 5.11: Photos of crossing 125231 in 2024.