Tributary to Kitwanga River - 198236 - Appendix
Site Location
PSCIS crossing 198236 is located on Tributary to Kitwanga River, on the Kitwancool Branch 2 FSR 4.3km upstream from the confluence with the Kitwanga River. The site is ~1.5km upstream of Kitwanga Lake (a.k.a Kitwancool Lake or Gitanyow Lake).
Although there are two crossing modelled as between the subject site and the Kitwanga River (modelled_crossing_id 8301996 and 8300438) that have not yet been inventoried, field observations and review of aerial imagery indicates that the crossing structures have been removed and fish access through this area is not likely hindered.
Background
Using salmon enumeration facilities to trap and count upstream migrating salmon, the Gitanyow Fisheries Authorities have demonstrated that Kitwanga Lake is one of the most productive sockeye nursery lakes for its size in all of BC (Gitanyow Fisheries Authority 2023). The Kitwanga River salmon enumeration facility is located approximately 4km north of the confluence with the Skeena river. This facility provides counts of five species of salmon: sockeye, chinook, coho, chum, and pink. In response to rapid declines in sockeye stocks, the Kitwanga Lake Sockeye Restoration project was started in 2006. Restoration efforts include environmental monitoring of the lake, assessment of sockeye spawning and rearing habitat, and hatchery rearing (Allen Gottesfeld, Barnes, and Soto 2009).
At crossing 198236, Tributary to Kitwanga River is a third order stream with a watershed area upstream of the crossing of approximately 4.8km2. The elevation of the watershed ranges from a maximum of 1760m to 449m near the crossing (Table 5.41). At the time of reporting, there was no fisheries information available for the areas upstream of crossing 198236.
fpr::fpr_table_wshd_sum(site_id = my_site) %>%
  fpr::fpr_kable(caption_text = paste0('Summary of derived upstream watershed statistics for PSCIS crossing ', my_site, '.'),
           footnote_text = 'Elev P60 = Elevation at which 60% of the watershed area is above',
scroll = F)| Site | Area Km | Elev Site | Elev Min | Elev Max | Elev Median | Elev P60 | Aspect |
|---|---|---|---|---|---|---|---|
| 198236 | 4.8 | 449 | 528 | 1760 | 1001 | 916 | SE |
| * Elev P60 = Elevation at which 60% of the watershed area is above |
PSCIS stream crossing 198236 was ranked as a moderate priority for follow up by the Society for Ecosystem Restoration in Northern BC following a review of bcfishpass modelling and background literature. A Fish Habitat Assessment Procedure was completed at this site in 2008 by members of the Skeena Fisheries Commission. At the time of assessment, it was concluded that the culvert presented a velocity barrier to juveniles. The habitat upstream was modelled at 8%. A summary of habitat modelling outputs is presented in Table 5.42. A map of the watershed is provided in map attachment 103P.115.
| Habitat | Potential | Remediation Gain | Remediation Gain (%) |
|---|---|---|---|
| ST Network (km) | 2.4 | 2.4 | 100 |
| ST Lake Reservoir (ha) | 0.0 | 0.0 | – |
| ST Wetland (ha) | 0.0 | 0.0 | – |
| ST Slopeclass03 Waterbodies (km) | 0.0 | 0.0 | – |
| ST Slopeclass03 (km) | 0.0 | 0.0 | – |
| ST Slopeclass05 (km) | 0.1 | 0.1 | 100 |
| ST Slopeclass08 (km) | 1.4 | 1.4 | 100 |
| ST Spawning (km) | 0.0 | 0.0 | – |
| ST Rearing (km) | 0.0 | 0.0 | – |
| CH Spawning (km) | 0.0 | 0.0 | – |
| CH Rearing (km) | 0.0 | 0.0 | – |
| CO Spawning (km) | 0.0 | 0.0 | – |
| CO Rearing (km) | 0.0 | 0.0 | – |
| CO Rearing (ha) | 0.0 | 0.0 | – |
| SK Spawning (km) | 0.0 | 0.0 | – |
| SK Rearing (km) | 0.0 | 0.0 | – |
| SK Rearing (ha) | 0.0 | 0.0 | – |
| * Model data is preliminary and subject to adjustments. |
Stream Characteristics at Crossing
At the time of the survey, PSCIS crossing 198236 was un-embedded, non-backwatered and ranked as a barrier barrier to upstream fish passage according to the provincial protocol (MoE 2011b) (Table 5.43). There was low flow through both culverts at the time of survey. Water temperature was 8\(^\circ\)C, pH was 8.3 and conductivity was 149uS/cm.
| Location and Stream Data |
|
Crossing Characteristics | – |
|---|---|---|---|
| Date | 2022-09-09 | Crossing Sub Type | Round Culvert |
| PSCIS ID | 198236 | Diameter (m) | 1.7 |
| External ID | – | Length (m) | 10 |
| Crew | AI JO | Embedded | No |
| UTM Zone | 9 | Depth Embedded (m) | – |
| Easting | 550300 | Resemble Channel | No |
| Northing | 6140708 | Backwatered | No |
| Stream | Tributary to Kitwanga River | Percent Backwatered | – |
| Road | Kitwancool Branch 2 FSR | Fill Depth (m) | 0.45 |
| Road Tenure | MoF 8687 | Outlet Drop (m) | 0.24 |
| Channel Width (m) | 2.3 | Outlet Pool Depth (m) | 0.22 |
| Stream Slope (%) | 1 | Inlet Drop | Yes |
| Beaver Activity | Yes | Slope (%) | 2 |
| Habitat Value | Medium | Valley Fill | Deep Fill |
| Final score | 26 | Barrier Result | Barrier |
| Fix type | Replace with New Open Bottom Structure | Fix Span / Diameter | 15 |
Photos: From top left clockwise: Road/Site Card, Barrel, Outlet, Downstream, Upstream, Inlet.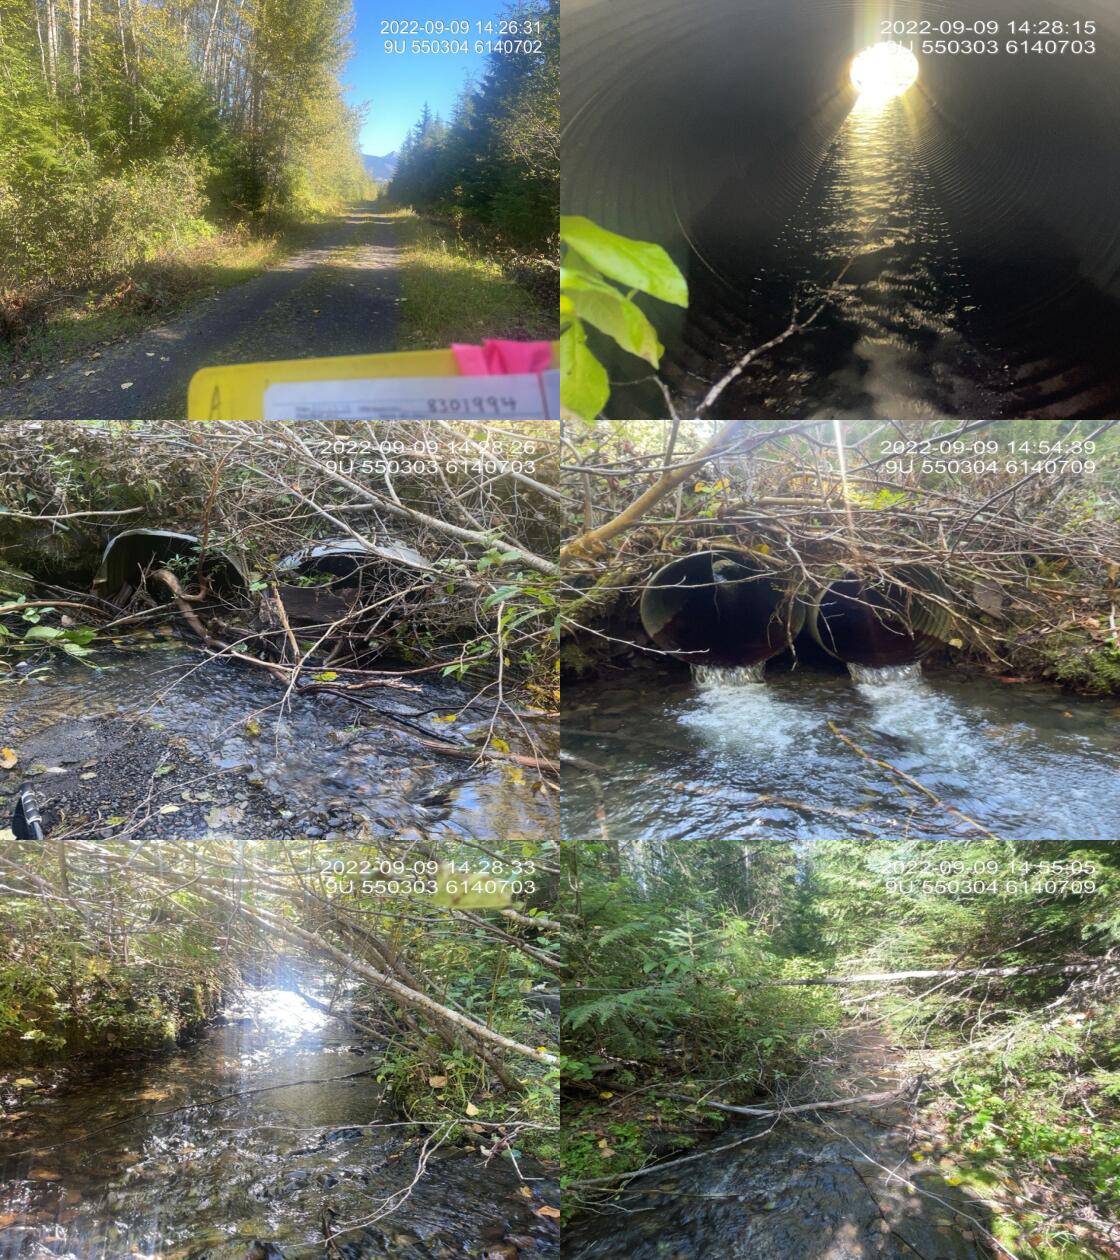
|
|||
| Comments: Two culverts side by side (0.85m each). 14:23 |
Stream Characteristics Downstream
The stream was surveyed downstream from crossing 198236 for 200m (Figures 5.51 - 5.52). The average channel width was 3.8m, the average wetted width was 2.3m, and the average gradient was 2.4%.Total cover amount was rated as moderate with overhanging vegetation dominant. Cover was also present as small woody debris.The dominant substrate was cobbles with gravels sub-dominant. There was abundant overhanging vegetation and a lot of downed trees. The stream mainly consisted of gravels and cobbles. There were infrequent shallow pools suitable for rearing. The habitat was rated as high value for salmonid rearing and spawning.
Stream Characteristics Upstream
The stream was surveyed upstream from crossing 198236 for 500m (Figures 5.53 - 5.56). The average channel width was 3m, the average wetted width was 2.6m, and the average gradient was 5.8%. The dominant substrate was gravels with cobbles sub-dominant. Total cover amount was rated as moderate with undercut banks dominant. Cover was also present as small woody debris, large woody debris, deep pools, and overhanging vegetation. There were abundant gravels noted as suitable for resident and anadromous salmonid spawning. There were frequent deep pools due to large woody debris in the canyon that was not logged. Overall, the habitat was rated as high value.
Structure Remediation and Cost Estimate
Should restoration/maintenance activities proceed, replacement of PSCIS crossing 198236 with a bridge (15m span) is recommended. The cost of the work is estimated at $450,000 for a cost benefit of 5.3 linear m/$1000 and 6.1 m2/$1000.
Conclusion
Although the habitat upstream of Kitwancool Branch 2 FSR was modelled at 8% which is greater than the steelhead rearing cutoff (7.5%) for high intrinsic potential (ie. likely “good” habitat), the average gradient was measured at 5.8% indicating that modelling outputs in Table 5.42 under-represent lower gradient habitat present. A reasonable estimate of the amount of habitat upstream of the crossing that is under 7.5% is approximately 2km. The areas surveyed rated as high value for salmonid rearing and spawning. Crossing 198236 was ranked as a moderate priority for proceeding to design for replacement.
tab_hab_summary %>%
  filter(Site  == my_site) %>%
  # select(-Site) %>%
  fpr::fpr_kable(caption_text = paste0('Summary of habitat details for PSCIS crossing ', my_site, '.'),
scroll = F) | Site | Location | Length Surveyed (m) | Channel Width (m) | Wetted Width (m) | Pool Depth (m) | Gradient (%) | Total Cover | Habitat Value |
|---|---|---|---|---|---|---|---|---|
| 198236 | Downstream | 200 | 3.8 | 2.3 | 0.3 | 2.4 | moderate | high |
| 198236 | Upstream | 500 | 3.0 | 2.6 | 0.4 | 5.8 | moderate | high |
my_photo1 = fpr::fpr_photo_pull_by_str(str_to_pull = '_d1_')

my_caption1 = paste0('Typical habitat downstream of PSCIS crossing ', my_site, '.')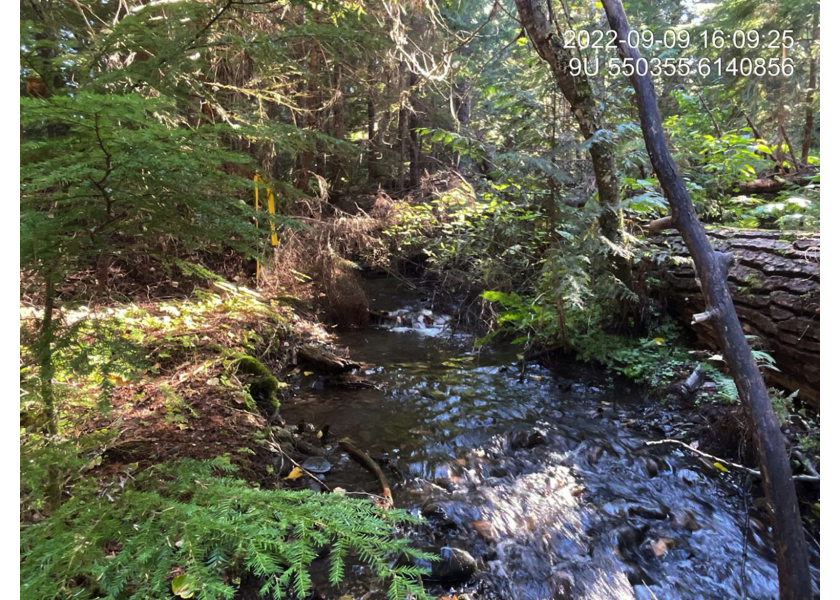
Figure 5.51: Typical habitat downstream of PSCIS crossing 198236.
my_photo2 = fpr::fpr_photo_pull_by_str(str_to_pull = '_d2_')

my_caption2 = paste0('Typical habitat downstream of PSCIS crossing ', my_site, '.')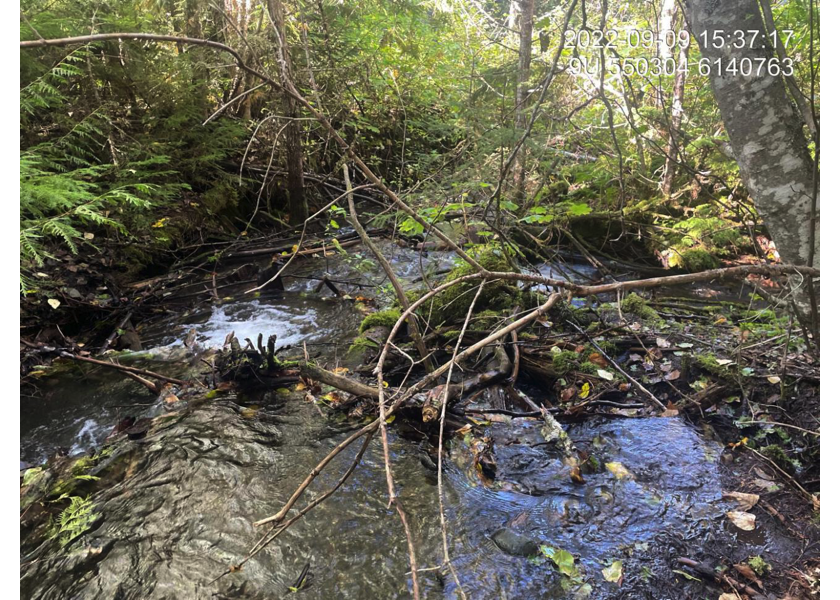
Figure 5.52: Typical habitat downstream of PSCIS crossing 198236.
my_caption <- paste0('Left: ', my_caption1, ' Right: ', my_caption2)

knitr::include_graphics(my_photo1)
knitr::include_graphics("fig/pixel.png")
knitr::include_graphics(my_photo2)
my_photo1 = fpr::fpr_photo_pull_by_str(str_to_pull = '_u1_')
my_caption1 = paste0('Typical habitat upstream of PSCIS crossing ', my_site, '.')
Figure 5.53: Typical habitat upstream of PSCIS crossing 198236.
my_photo2 = fpr::fpr_photo_pull_by_str(str_to_pull = '_u2_')

my_caption2 = paste0('Typical habitat upstream of PSCIS crossing ', my_site, '.')
Figure 5.54: Typical habitat upstream of PSCIS crossing 198236.
my_caption <- paste0('Left: ', my_caption1, ' Right: ', my_caption2)

knitr::include_graphics(my_photo1)
knitr::include_graphics("fig/pixel.png")
knitr::include_graphics(my_photo2)
my_photo1 = fpr::fpr_photo_pull_by_str(str_to_pull = '_u3_')
my_caption1 = paste0('Typical habitat upstream of PSCIS crossing ', my_site, '.')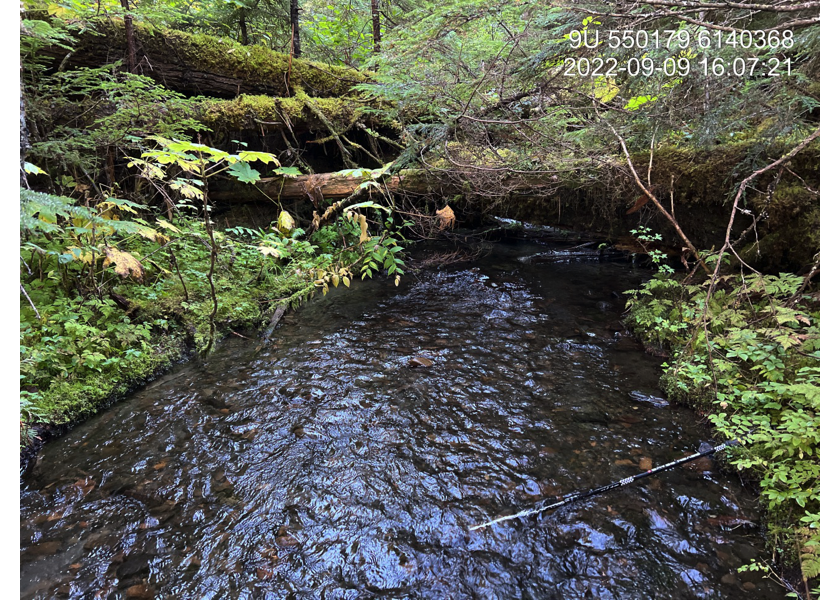
Figure 5.55: Typical habitat upstream of PSCIS crossing 198236.
my_photo2 = fpr::fpr_photo_pull_by_str(str_to_pull = '_u4_')

my_caption2 = paste0('Typical habitat upstream of PSCIS crossing ', my_site, '.')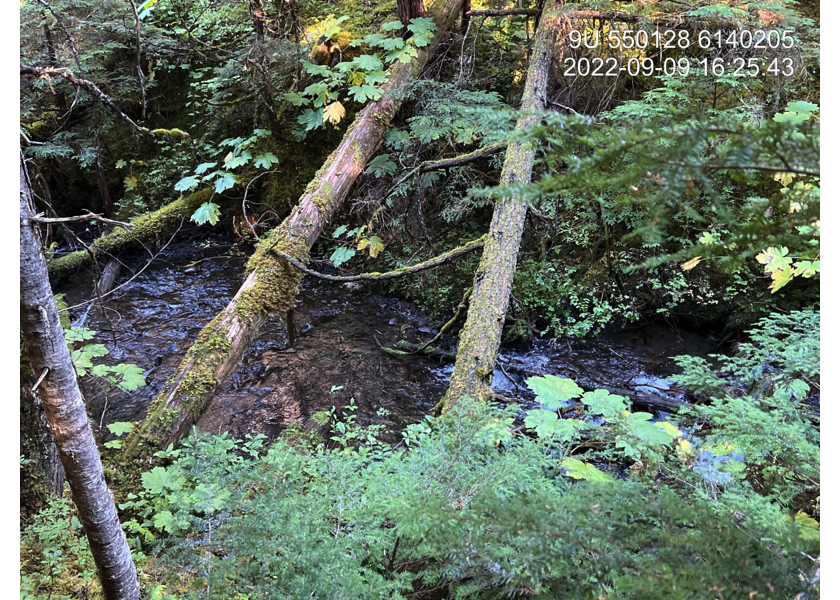
Figure 5.56: Typical habitat upstream of PSCIS crossing 198236.
my_caption <- paste0('Left: ', my_caption1, ' Right: ', my_caption2)

knitr::include_graphics(my_photo1)
knitr::include_graphics("fig/pixel.png")
knitr::include_graphics(my_photo2)