Tributary to Skeena River - 198216 & 198217 - Appendix
Site Location
PSCIS crossing 198216 and 198217 are located on a Tributary to Skeena River, just outside the small community of Sik-E-Dakh (Glen Vowell). Crossing 198216 is located 1.8km upstream from the confluence with the Skeena River on Kispiox Valley Rd and is the responsibility of the Ministry of Transportation and Infrastructure. Crossing 198217 is located on Sik-e-dakh Water Tower Rd 300m upstream from Kispiox Valley Rd and appears to be under the jurisdiction of the Sik-E-Dakh 2 Indian Reserve.
Background
Located on the west side of the Skeena River, between Hazelton and Kispiox, Sik-E-Dakh is a Gitxsan community home to the Glen Vowell Band. “Sik-E-Dakh” means “Bright Lights Behind Mountain” (“Sik-E-Dakh (Glen Vowell Band)” 2023). The subject stream supplies drinking water to the community with drinking water storage and treatment infrastructure located on Sik-e-dakh Water Tower Rd beyond the location of 198217. The underlying territory of this stream is within the Xsu Wii Masxwit/ Antgililibixw Wilp.
Approximately 300m north of crossing 198217 on Kispiox Valley Road, GIS modelling indicates there is a crossing located on Glen Vowell Creek (modelled crossing ID 8300064). This area was canvassed and there was no culvert or structure found. In 2018, (Triton Environmental Consultants Ltd. 2020) electrofished a section of Glen Vowell Creek upstream of modelled crossing 8301266 and captured cutthroat and dolly varden. This stream is mapped as immediately north of the flows east before draining into the Skeena River. Immediately before the confluence, GIS modelling indicates there is a crossing located on Peter Brown Drive (modelled crossing ID 8300001) however, this location was also investigated and there was no crossing found. There are some discrepancies between the mapped stream channel locations in the BC freshwater atlas and the actual on the ground reality. This could be the result of anthroprogenic influences (ie. dredged stream channels or channel redirection due to protection of road and community infrastructure).
At crossing 198216, Tributary to Skeena River is a second order stream with a watershed area upstream of the crossing of approximately 5.5km2. The elevation of the watershed ranges from a maximum of 1287m to 243m near the crossing (Table 5.15). At the time of reporting, there was no fisheries information available for the area upstream of the highway crossing 198216 (MoE 2020b; Norris 2022). Local knowledge holder (Chief Francis), noted that the local community historically harvested coho from the stream. Gitksan Watershed Authorities and local residents are working together to gather information about the system from elders and other local knowledge holders in the community to help inform watershed restoration planning. There is concern in the community that the stream flows are not as consistent as in the past and there are hopes that restoration activities could help increase fisheries productivity in the system. There is a network of dykes surrounding the Sik-e-Dakh community.
fpr::fpr_table_wshd_sum(site_id = my_site) %>%
  fpr::fpr_kable(caption_text = paste0('Summary of derived upstream watershed statistics for PSCIS crossing ', my_site, '.'),
           footnote_text = 'Elev P60 = Elevation at which 60% of the watershed area is above',
scroll = F)| Site | Area Km | Elev Site | Elev Min | Elev Max | Elev Median | Elev P60 | Aspect |
|---|---|---|---|---|---|---|---|
| 198216 | 5.5 | 237 | 243 | 1287 | 483 | 401 | ESE |
| * Elev P60 = Elevation at which 60% of the watershed area is above |
A summary of habitat modelling outputs is presented in Table 5.16. Note that the BC freshwater atlas does not capture the upstream watershed, therefore the modelling is likely inaccurate. A map of the watershed is provided in map attachment 093M.106. A digital elevation model of the area is presented in Figure 5.19 (BC Government 2022).
| Habitat | Potential | Remediation Gain | Remediation Gain (%) |
|---|---|---|---|
| ST Network (km) | 5.7 | 5.7 | 100 |
| ST Lake Reservoir (ha) | 0.0 | 0.0 | – |
| ST Wetland (ha) | 6.6 | 6.6 | 100 |
| ST Slopeclass03 Waterbodies (km) | 0.6 | 0.0 | 0 |
| ST Slopeclass03 (km) | 1.2 | 1.2 | 100 |
| ST Slopeclass05 (km) | 0.0 | 0.0 | – |
| ST Slopeclass08 (km) | 2.0 | 2.0 | 100 |
| ST Spawning (km) | 0.2 | 0.2 | 100 |
| ST Rearing (km) | 0.5 | 0.5 | 100 |
| CH Spawning (km) | 0.2 | 0.2 | 100 |
| CH Rearing (km) | 0.2 | 0.2 | 100 |
| CO Spawning (km) | 0.2 | 0.2 | 100 |
| CO Rearing (km) | 0.2 | 0.2 | 100 |
| CO Rearing (ha) | – | 0.0 | – |
| SK Spawning (km) | 0.0 | 0.0 | – |
| SK Rearing (km) | 0.0 | 0.0 | – |
| SK Rearing (ha) | – | 0.0 | – |
| * Model data is preliminary and subject to adjustments. |
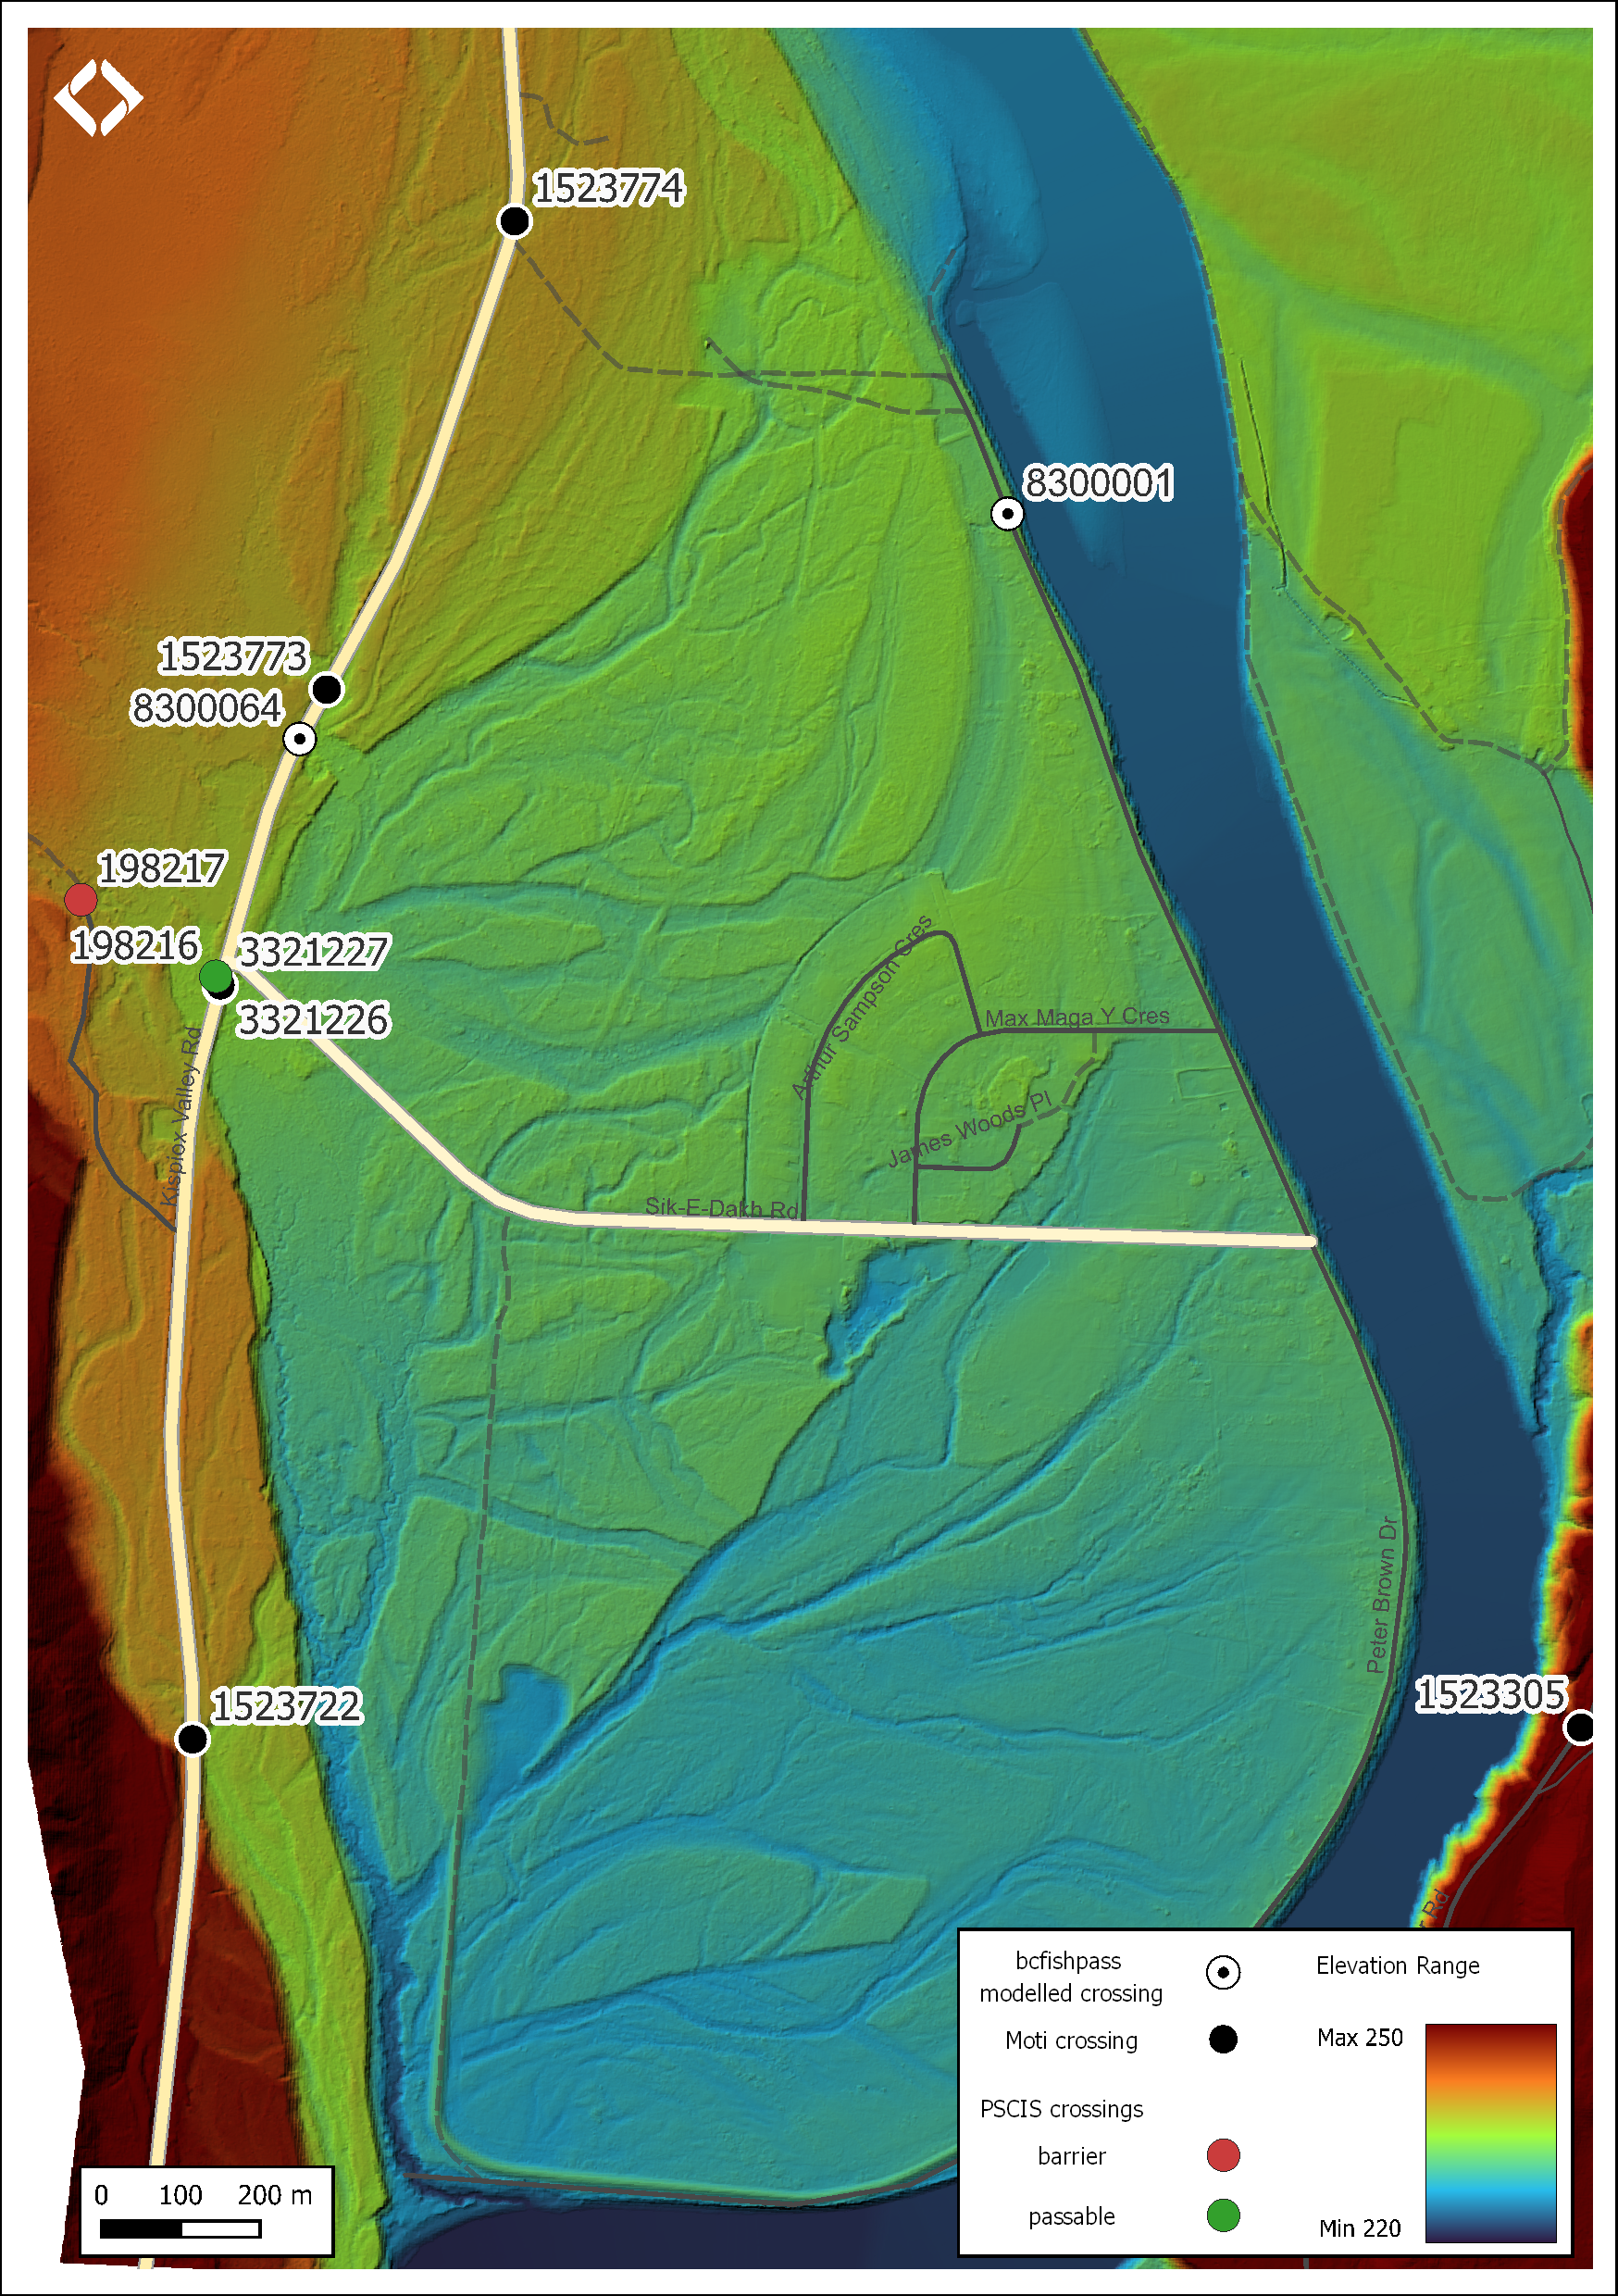
Figure 5.19: Digital elevation model of the watershed outside the community of Sik-E-Dakh.
5.2 Climate Change Risk Assessment
Preliminary climate change risk assessment data for PSCIS site 198217 on Sik-e-dakh Water Tower Rd is presented in Tables 5.17 - 5.18.
| Condition and Climate Risk | Rank | Priority | Rank |
|---|---|---|---|
| Erosion (scale 1 low - 5 high) | 1 | Traffic Volume 1 (low) 5 (medium) 10 (high) | 8 |
| Embankment fill issues 1 (low) 2 (medium) 3 (high) | 1 | Community Access - Scale - 1 (high - multiple road access) 5 (medium - some road access) 10 (low - one road access) | 10 |
| Blockage Issues 1 (0-30%) 2 (>30-75%) 3 (>75%) | 2 | Cost (scale: 1 high - 10 low) | 2 |
| Condition Rank = embankment + blockage + erosion | 4 | Constructibility (scale: 1 difficult -10 easy) | 2 |
| Likelihood Flood Event Affecting Culvert (scale 1 low - 5 high) | 1 | Environmental Impacts (scale: 1 high -10 low) | 9 |
| Consequence Flood Event Affecting Culvert (scale 1 low - 5 high) | 4 | Fish Bearing 10 (Yes) 0 (No) - see maps for fish points | 10 |
| Climate Change Flood Risk (likelihood x consequence) 1-6 (low) 6-12 (medium) 10-25 (high) | 4 | Priority Rank = traffic volume + community access + cost + constructability + fish bearing + environmental impacts | 41 |
| Vulnerability Rank = Condition Rank + Climate Rank | 8 | Overall Rank = Vulnerability Rank + Priority Rank | 49 |
| Category | Comments |
|---|---|
| Condition | Large amount of flow is going in between the two pipes and not through them. Trash guards on inlets are quite damaged. Beaverdams located immediately down stream. Roadfill material is made of road barriers. Pipes are in bad shape. |
| Climate | Significant amounts of water moving through here and this highway is a major corridor for people living in the Kispiox community and associated valley upstream. |
| Priority | – |
Stream Characteristics at Crossings
PSCIS crossing 198216 was embedded, backwatered and ranked as passable to upstream fish passage (Table 5.19). There were two culverts side by side, and both of them had trash racks on the inlet side that could be a barrier to adult coho. The trash rack had grid sizes of approximately 13cm by 13cm.
At the time of the survey, PSCIS crossing 198217 was comprised of two pipes. The outlet drops were measured as 0.6m with both pipes un-embedded and non-backwatered. The crossing ranked as a barrier to upstream fish passage according to the provincial protocol (MoE 2011b) (Table 5.20). Water temperature was 9.2\(^\circ\)C, pH was 7.6 and conductivity was 133uS/cm.
| Location and Stream Data |
|
Crossing Characteristics | – |
|---|---|---|---|
| Date | 2022-09-09 | Crossing Sub Type | Round Culvert |
| PSCIS ID | 198216 | Diameter (m) | 2 |
| External ID | – | Length (m) | 24 |
| Crew | AI | Embedded | Yes |
| UTM Zone | 9 | Depth Embedded (m) | 0.2 |
| Easting | 583025.5 | Resemble Channel | Yes |
| Northing | 6130402 | Backwatered | Yes |
| Stream | Tributary to Skeena River | Percent Backwatered | 95 |
| Road | Kispiox Valley Rd | Fill Depth (m) | 3 |
| Road Tenure | MoTi Arterial | Outlet Drop (m) | 0 |
| Channel Width (m) | 5.6 | Outlet Pool Depth (m) | 0.8 |
| Stream Slope (%) | 1.5 | Inlet Drop | Yes |
| Beaver Activity | Yes | Slope (%) | 0.5 |
| Habitat Value | High | Valley Fill | Deep Fill |
| Final score | 14 | Barrier Result | Passable |
| Fix type | – | Fix Span / Diameter | – |
Photos: From top left clockwise: Road/Site Card, Barrel, Outlet, Downstream, Upstream, Inlet.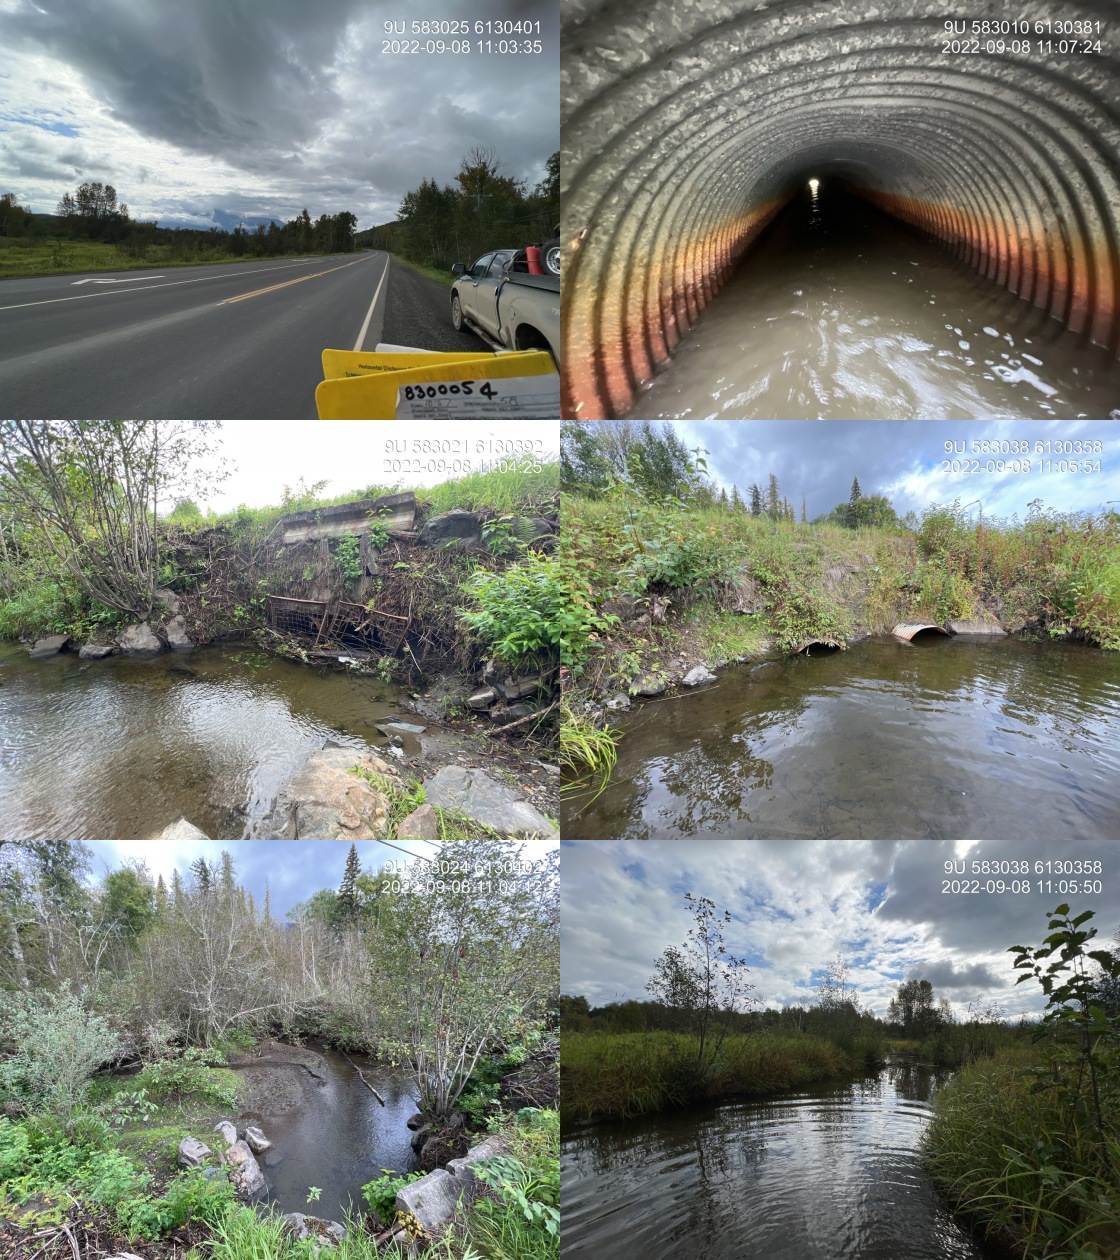
|
|||
| Comments: Culvert appears very old and near end of life. Nice gravels upstream. Flow is moving between the two 1 m pipes. Trash rack on inlet could be barrier to adult coho migrating upstream. 10:57 |
| Location and Stream Data |
|
Crossing Characteristics | – |
|---|---|---|---|
| Date | 2022-09-09 | Crossing Sub Type | Round Culvert |
| PSCIS ID | 198217 | Diameter (m) | 2.5 |
| External ID | – | Length (m) | 10 |
| Crew | AI | Embedded | No |
| UTM Zone | 9 | Depth Embedded (m) | – |
| Easting | 582851.3 | Resemble Channel | No |
| Northing | 6130491 | Backwatered | No |
| Stream | Tributary to Skeena River | Percent Backwatered | – |
| Road | Sik-e-dakh Water Tower Rd | Fill Depth (m) | 1 |
| Road Tenure | Resource | Outlet Drop (m) | 0.6 |
| Channel Width (m) | 5.6 | Outlet Pool Depth (m) | 0.7 |
| Stream Slope (%) | 1.5 | Inlet Drop | Yes |
| Beaver Activity | Yes | Slope (%) | 3.5 |
| Habitat Value | High | Valley Fill | Deep Fill |
| Final score | 36 | Barrier Result | Barrier |
| Fix type | Replace with New Open Bottom Structure | Fix Span / Diameter | 15 |
Photos: From top left clockwise: Road/Site Card, Barrel, Outlet, Downstream, Upstream, Inlet.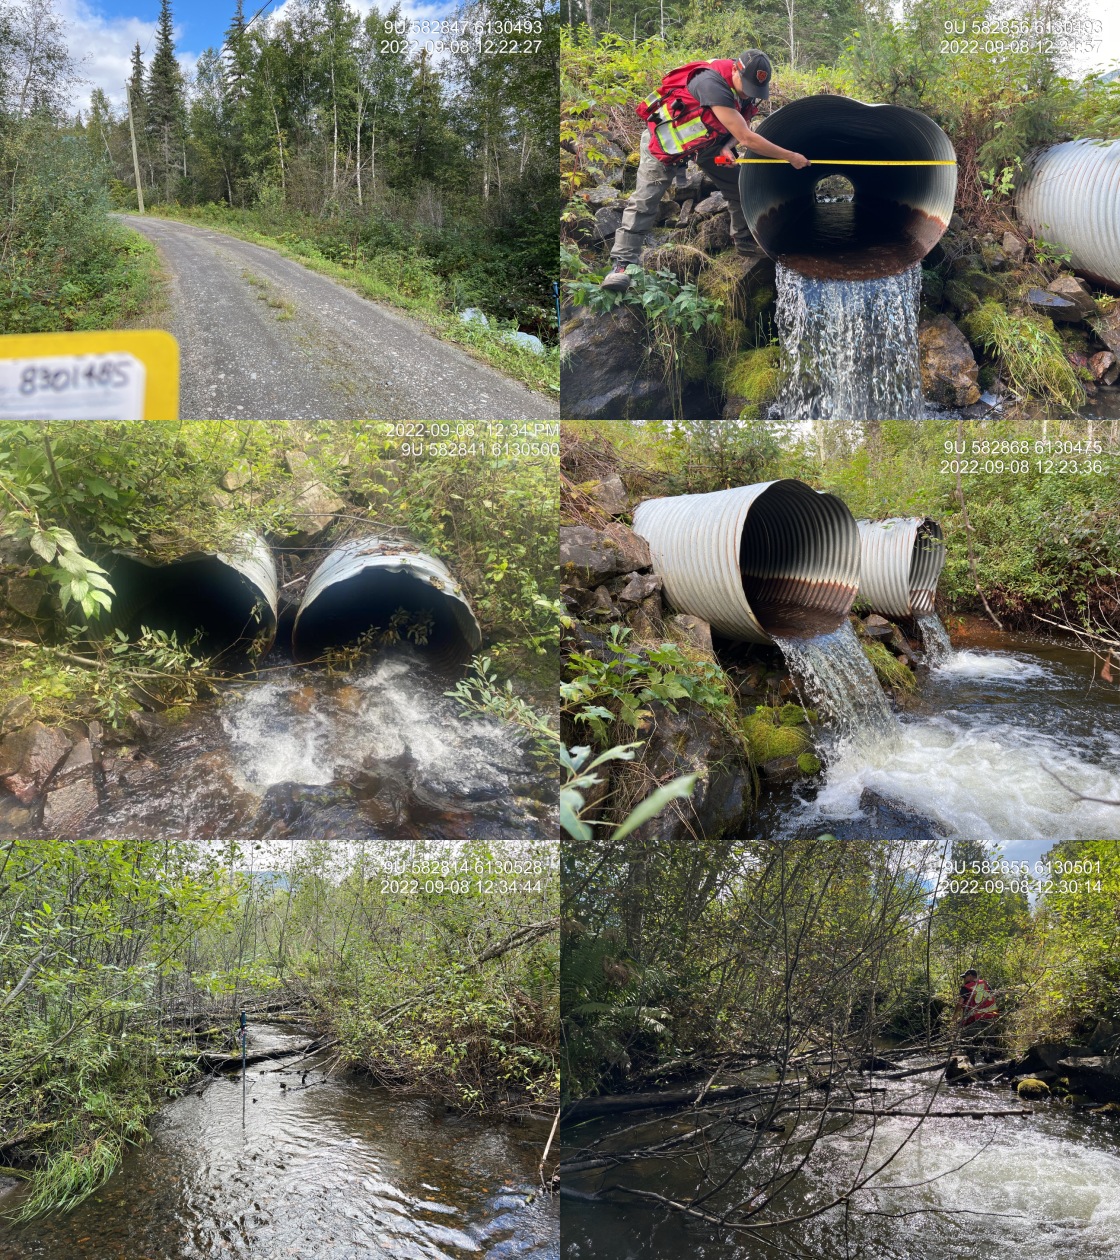
|
|||
| Comments: Francis (chief) indicated this is historic coho harvest site for Glen Vowell community and historic coho spawning stream. 2 1.25m culverts side by side. Trash rack has been removed from inlet. Inlet has significant amount of debris. Extensive gravels present suitable for CO spawning upstream and downstream. Good flow and large stream. On road to water treatment plant. 12:20 |
##this is useful to get some comments for the report
hab_site %>% filter(site == my_site2 & location == 'ds') %>% pull(comments)
hab_site %>% filter(site == my_site2 & location == 'us') %>% pull(comments)
my_photo1 = fpr::fpr_photo_pull_by_str(site = my_site, str_to_pull = '_trashrack_')
my_caption1 = paste0('Trash rack on inlet side of PSCIS crossing ', my_site, '.')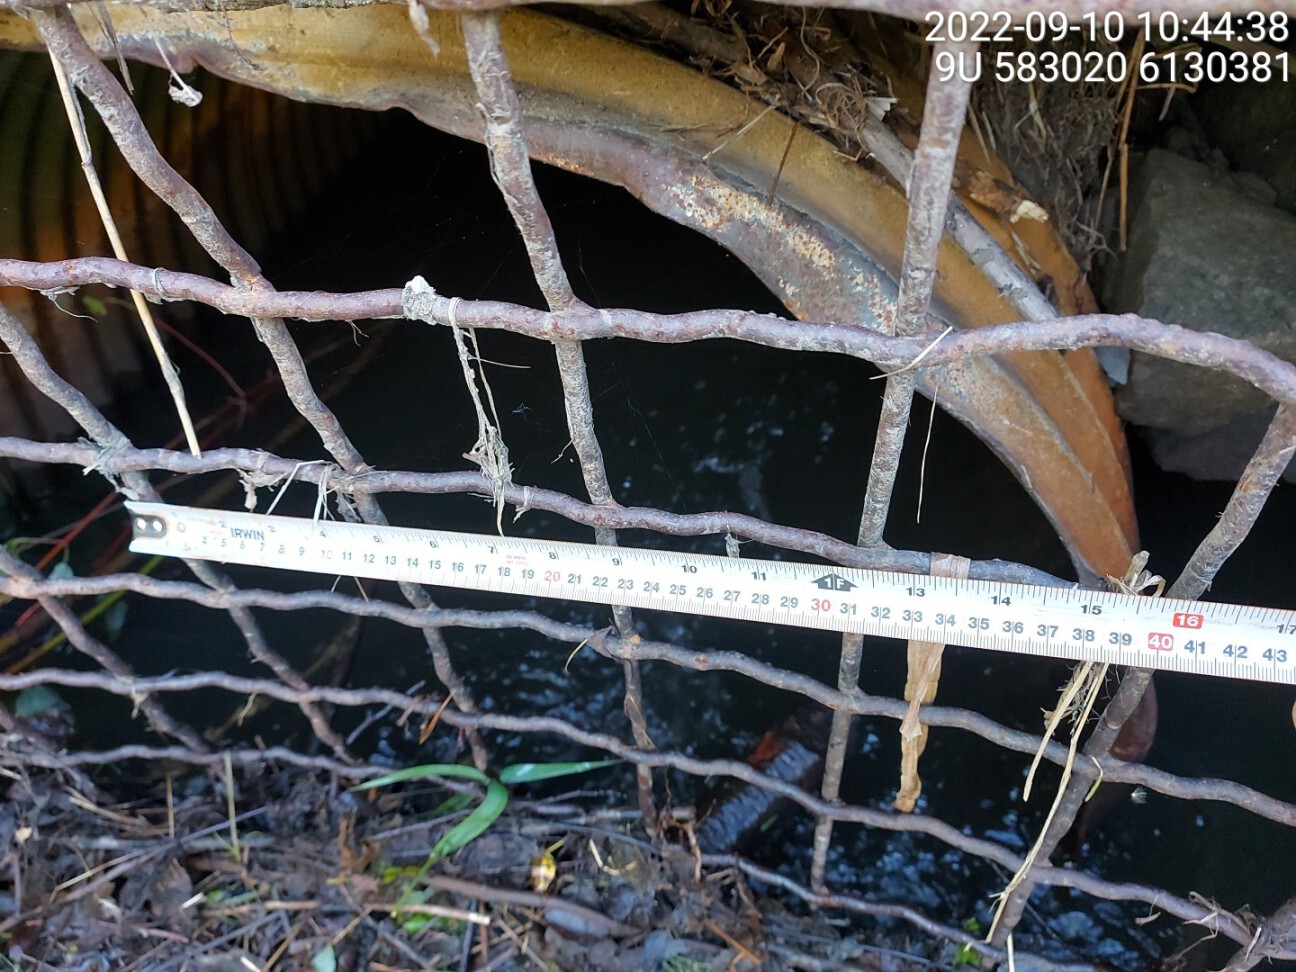
Figure 5.20: Trash rack on inlet side of PSCIS crossing 198216.
Stream Characteristics Downstream of 198216
The area downstream of crossing 198216 consisted of open wetland habitat with shrubs and floodplains. There was a beaver dam approximately 100m downstream of the culvert. Surveys were conducted with a remotely piloted aircraft with resulting images stitched into an orthomosaic presented in Figures 5.21 - 5.22.
Stream Characteristics Upstream of 198216 and Downstream of 198217
The stream was surveyed downstream from crossing 198217 for 300m to crossing 198216 (Figures 5.24 - 5.25). The average channel width was 5m, the average wetted width was 2.9m, and the average gradient was 1.8%.Total cover amount was rated as moderate with large woody debris dominant. Cover was also present as small woody debris.The dominant substrate was fines with gravels sub-dominant. The area surveyed was mostly wetland habitat, with three large beaver dams spaced evenly along surveyed length. Multiple channels were present after the first beaver dam, separated by heavily vegetated banks. There was muddy bed material with some fines and gravels but nothing bigger. More gravels were present closer to crossing 198216 that were suitable for spawning. There were abundant deep pools present near wetland that could be suitable for rearing if habitat is opened up. The habitat was rated as medium value as an important migration corridor containing suitable spawning habitat and having moderate rearing potential for resident and anadromous salmonids. The area immediately upstream of 198216 was also surveyed by drone presented in Figures 5.21 - 5.22.
Stream Characteristics Upstream of 198217
## three different sections were surveyed, pull comments on all three to help with writing
hab_site %>% filter(site == my_site2 & location == 'us') %>% pull(comments)
hab_site %>% filter(site == my_site2 & location == 'us2') %>% pull(comments)
hab_site %>% filter(site == my_site2 & location == 'us3') %>% pull(comments)
Three sections of stream upstream of Sik-e-dakh Water Tower Rd were surveyed. Two were located within the main drainage for the watershed with the third located within a smaller tributary to the mainstream that entered the system on the upstream side of a large beaver impounded area approximately 260m upstream of the road.
The first section of stream surveyed began in the main drainage for the watershed immediately upstream of crossing 198217 for 300m (Figures 5.26 - 5.27). The average channel width was 6m, the average wetted width was 3.4m, and the average gradient was 2.5%.Total cover amount was rated as moderate with undercut banks dominant. Cover was also present as small woody debris, large woody debris, deep pools, and overhanging vegetation.The dominant substrate was gravels with cobbles sub-dominant. Abundant gravels were present suitable for coho, steelhead, and rainbow spawning. Multiple large beaver dams were present within the area surveyed with the upstream end of the site adjacent to a beaver dam complex. The habitat was rated as high value for salmonid rearing and spawning.
The second section of mainstem was surveyed for 275m with the downstream end of the area surveyed located approximately 360m upstream of Sik-e-dakh Water Tower Rd. The average channel width was 5m, the average wetted width was 3.3m, and the average gradient was 4.7%.Total cover amount was rated as moderate with deep pools dominant. Cover was also present as small woody debris, large woody debris, boulders, undercut banks, and overhanging vegetation.The dominant substrate was gravels with cobbles sub-dominant. Abundant gravels were noted as present and suitable for spawning coho and other smaller resident salmonids. There were sporadic pools suitable for juvenile coho and steelhead overwintering and the mature old growth mixed riparian provided a stable channel with abundant large woody debris. Wildlife trails were found throughout the forest and the habitat was rated as high value for salmonid rearing and spawning.
The third section of stream surveyed was located on a smaller tributary that enters the main drainage in the watershed at the location of a large beaver impounded wetland. The surveyed site length was 100m. Total cover amount was rated as moderate with undercut banks dominant. Cover was also present as small woody debris, large woody debris, and overhanging vegetation.The dominant substrate was gravels with cobbles sub-dominant.The average channel width was 1.6m, the average wetted width was 1.4m, and the average gradient was 10%. Multiple small steps from large and small woody debris with heights ranging from 20-40cm were present at the time of survey. The stream was surrounded by an old growth riparian forest and habitat was rated as medium value for juvenile salmonid rearing. Habitat present likely provides areas of habitat suitable for spawning of resident salmonids but the smaller size of the stream is not likely suitable for adult anadromous salmonid spawning.
model_url <- '<iframe src="https://www.mapsmadeeasy.com/maps/public/744a9804752947d9ba769e53b8c9deec/" scrolling="no" title="Maps Made Easy" width="100%" height="600" frameBorder ="0"></iframe>'

knitr::asis_output(model_url)
my_photo = 'fig/pixel.png'
my_caption = paste0('Orthomosaic of habitat upstream and downstream of PSCIS crossing 198216.')
knitr::include_graphics(my_photo, dpi = NA)Figure 5.21: Orthomosaic of habitat upstream and downstream of PSCIS crossing 198216.
model_url <- '<iframe src="https://www.mapsmadeeasy.com/maps/public_3D/744a9804752947d9ba769e53b8c9deec/" scrolling="no" title="Maps Made Easy" width="100%" height="600" frameBorder ="0"></iframe>'

knitr::asis_output(model_url)
my_photo = 'fig/pixel.png'
my_caption = paste0('3D model of habitat upstream and downstream of PSCIS crossing 198216. To zoom press "shift" and scroll.')
knitr::include_graphics(my_photo, dpi = NA)Figure 5.22: 3D model of habitat upstream and downstream of PSCIS crossing 198216. To zoom press “shift” and scroll.
Fish Sampling
In 2023, crossing 198217 was revisited and electrofishing was conducted with results summarised in Tables 5.22 - 5.23 and Figure 5.23. A total of 36 fish were captured upstream and 41 fish were captured downstream (Figures 5.28 - 5.29). Cutthroat trout were captured downstream of the crossing, and dolly varden and cutthroat trout were captured downstream. All fish captured with a fork length greater than 60mm were tagged with Passive Integrated Transponders (PIT tags) with data stored here.
Structure Remediation and Cost Estimate
Although replacement of PSCIS crossing 198217 with a bridge (15m span with a cost estimated at $375,000) is tentatively recommended. However,as alternative options may provide greater restoration actions (ex. relocation of the crossing structure), conditions within the greater watershed should be assessed more comprehensively first to determine how the channel alignment and wetland configuration/capacity (between Water Tower Road and the Skeena River) have been impacted by the installation of roads and Sik-E-Dakh community infrastructure.
Conclusion and Recommendations
There was more than 0.8km of habitat modelled upstream of crossing 198217 with gradients less than 10%. Habitat within areas surveyed rated as high value for coho rearing and spawning. At the time of 2024 reporting, in collaboration with the local Sik-E-Dakh community, a plan to gather local knowledge, provide educational opportunities for local community members and eventually rehabilitate this system was underway - led by the Gitksan Watershed Authorities. Additionally, in 2023 Gitskan Watershed Authorities acquired Salmon Restoration and Innovation Fund dollars to facilitate the physical works to replace the crossings on Sik-e-dakh Water Tower Rd. An engineering design was completed for this site in 2023 by Onsite Engineering with funding provided through SERNbc and replacement of the crossing is scheduled for the summer of 2024.
Recommendations from reporting conducted in 2023 are included below with updates from 2024 include in red where applicable:
- If it can be located, conduct an assessment of modelled crossing 8301266, located approximately 375m further up Water Tower Road from crossing 198217. During the assessment, survey upstream and downstream (several hundred meters if possible) to try to determine if (and how much) water flows where this stream segment has been mapped in the freshwater atlas of BC.
Update 2024: Survey crews from Onsite engineering attempted to locate modelled crossing 8301266 in the summer of 2023. The crossing was not located and is not likely present.
As the extent/duration of seasonal dewatering could decrease and the amount of rearing habitat available increased by encouraging water retention in beaver influenced wetland areas, an inventory of beaver dams, analysis of the watershed with the beaver restoration assessment tool and wetland mapping is recommended. Additionally, we recommend engaging with Ministry of Transportation and Infrastructure representatives and contractors to understand site constraints, road maintenance issues and explore the possibility of increasing water storage within the wetland areas located upstream and downstream of the highway.
Electrofishing and PIT tagging within the main drainage of the watershed upstream and downstream of crossing 198217 is recommended to provide insight into fish community composition, density, survival and movement.
Update 2024: Baseline assessemnt work conducted in the summer of 2023 with results presented within this memo. Fish over 60mm were tagged with PIT tags so that their movement and health can be tracked as part of effectiveness monitoring at the site.
- Acquisition of lidar data for areas to the west of current data available on LidarBC (includes area of water intake facilities) to provide information about potential channel and wetland locations. Analysis of this data could provide insight into historic channel dredging/redirections and inform restoration actions.
Update 2024: Lidar data was acquired in summer of 2023 and loaded to collaborative QGIS project hosted on cloud server (Mergin Maps). Review of data provided no indication of historic channel dredging/redirections and indicates that - as expected - the mapped location of main flow in the watershed is erroneous in the BC freshwater atlas.
Acquisition of temperature data at points likely to contain water all year long (ex. outlet of culverts and upstream of culvert on water tower road). Acquire data for the entire growing season and include areas from main north channel to elevations where coho are expected to populate. The growing season can be defined as per Coleman and Fausch (2007), which delineate the beginning as the first day of the week that average stream temperatures exceed 5\(^\circ\)C in the spring and the end as the last day of the week that average stream temperature drops below 4\(^\circ\)C.
Delineation of reaches and acquisition of habitat data incorporating Fish Habitat Assessment Procedures (Johnston and Slaney 1996) within all reaches expected to be populated by coho. An adaptation of assessments (ex. degree of channel incision and percentage of floodplain utilized by the stream) developed to informed low-tech process-based restoration activities (beaver dam analogues and post assisted log structures) could be incorporated into FHAP assessments as per Wheaton et al. (2019).
Acquire high resolution RGB imagery for the entire area from the confluence to above the water intake infrastructure. Include areas on the west side of the highway where there is the remnant channel on the south of water tower culverts and wetland areas to the north.
Update 2024: High resolution imagery was collected at the same time as lidar data acquisition for the same area surveyed with lidar (primarily upstream of the highway to above the water intake facility) data acquired in summmer of 2023 and loaded to collaborative QGIS project hosted on cloud server (Mergin Maps). Review of data provided no indication of historic channel dredging/redirections and indicates that - as expected - the mapped location of main flow in the watershed is erroneous in the BC freshwater atlas.
Coho spawner surveys to coincide with known spawning timing in neighbouring systems.
Snorkel and/or go pro surveys of plunge pool areas below culverts at times of steelhead and coho migrations to scope for adults attempting to ascend the watershed.
Overall outreach program to gather historic fisheries information for the system and to scope for knowledge regarding alterations to the subject stream trajectory/floodplain. Through this process of two way education, Kispiox valley residents and restoration practitioners could learn/teach about the role of beavers in local watershed health as well as the history of impacts to aquatic values due to road, community, and ranch development in the area.
Acquisition of hydrometric information in accordance with the Manual of British Columbia Hydrometric Standards (Resources Information Standards Committee 2018) to build stage discharge curves for the watershed so the relationships between fish life history timings, physical habitat suitability, temperature and flows can be better understood.
tab_hab_summary %>%
  filter(Site  == my_site | Site == my_site2) %>%
  fpr::fpr_kable(caption_text = paste0('Summary of habitat details for PSCIS crossing ', my_site, ' and ', my_site2, '.'),
scroll = F) | Site | Location | Length Surveyed (m) | Channel Width (m) | Wetted Width (m) | Pool Depth (m) | Gradient (%) | Total Cover | Habitat Value |
|---|---|---|---|---|---|---|---|---|
| 198216 | Downstream | – | – | – | – | 1.0 | none | – |
| 198217 | Downstream | 300 | 5.0 | 2.9 | 0.4 | 1.8 | moderate | medium |
| 198217 | Upstream | 300 | 6.0 | 3.4 | 0.4 | 2.5 | moderate | high |
| 198217 | Upstream2 | 100 | 1.6 | 1.4 | – | 10.0 | moderate | medium |
| 198217 | Upstream3 | 275 | 5.0 | 3.3 | 0.3 | 4.7 | moderate | high |
| site | passes | ef_length_m | ef_width_m | area_m2 | enclosure |
|---|---|---|---|---|---|
| 198217_ds_ef1 | 1 | 6 | 4.03 | 24.2 | Open |
| 198217_ds_ef2 | 1 | 14 | 3.30 | 46.2 | Open |
| 198217_ds_ef3 | 1 | 1 | 5.30 | 5.3 | Open |
| 198217_us_ef1 | 1 | 10 | 3.17 | 31.7 | Open |
| 198217_us_ef2 | 1 | 13 | 3.63 | 47.2 | Open |
| 198217_us_ef3 | 1 | 8 | 2.87 | 23.0 | Open |
| local_name | species_code | life_stage | catch | density_100m2 | nfc_pass |
|---|---|---|---|---|---|
| 198217_ds_ef1 | CT | fry | 6 | 24.8 | FALSE |
| 198217_ds_ef2 | CT | fry | 8 | 17.3 | FALSE |
| 198217_ds_ef2 | CT | parr | 2 | 4.3 | FALSE |
| 198217_ds_ef2 | DV | fry | 2 | 4.3 | FALSE |
| 198217_ds_ef2 | DV | adult | 1 | 2.2 | FALSE |
| 198217_ds_ef3 | CT | fry | 1 | 18.9 | FALSE |
| 198217_ds_ef3 | CT | parr | 8 | 150.9 | FALSE |
| 198217_ds_ef3 | CT | juvenile | 2 | 37.7 | FALSE |
| 198217_ds_ef3 | DV | fry | 2 | 37.7 | FALSE |
| 198217_ds_ef3 | DV | parr | 2 | 37.7 | FALSE |
| 198217_ds_ef3 | DV | juvenile | 6 | 113.2 | FALSE |
| 198217_ds_ef3 | DV | adult | 1 | 18.9 | FALSE |
| 198217_us_ef1 | CT | fry | 11 | 34.7 | FALSE |
| 198217_us_ef1 | CT | parr | 2 | 6.3 | FALSE |
| 198217_us_ef2 | CT | fry | 9 | 19.1 | FALSE |
| 198217_us_ef2 | CT | parr | 4 | 8.5 | FALSE |
| 198217_us_ef2 | CT | adult | 1 | 2.1 | FALSE |
| 198217_us_ef3 | CT | fry | 1 | 4.3 | FALSE |
| 198217_us_ef3 | CT | parr | 3 | 13.0 | FALSE |
| 198217_us_ef3 | CT | juvenile | 2 | 8.7 | FALSE |
| 198217_us_ef3 | CT | adult | 3 | 13.0 | FALSE |
|
* nfc_pass FALSE means fish were captured in final pass indicating more fish of this species/lifestage may have remained in site. Mark-recaptured required to reduce uncertainties. |
my_caption <- paste0('Densites of fish (fish/100m2) captured upstream and downstream of PSCIS crossing ', my_site2, '.')

fpr_plot_fish_box(dat = fish_abund_2023, sit = my_site2) 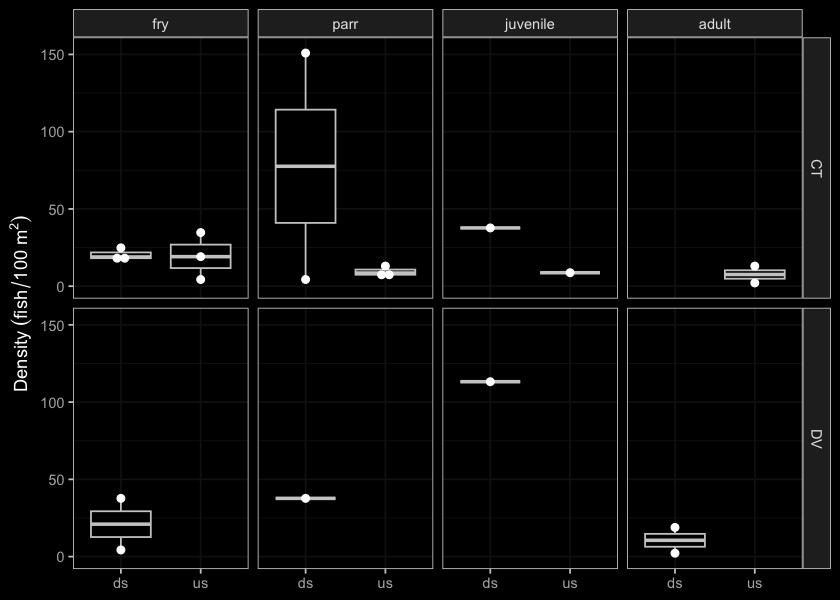
Figure 5.23: Densites of fish (fish/100m2) captured upstream and downstream of PSCIS crossing 198217.
my_photo1 = fpr::fpr_photo_pull_by_str(site = my_site2, str_to_pull = '_d1_')

my_caption1 = paste0('Typical habitat downstream of PSCIS crossing ', my_site2, '.')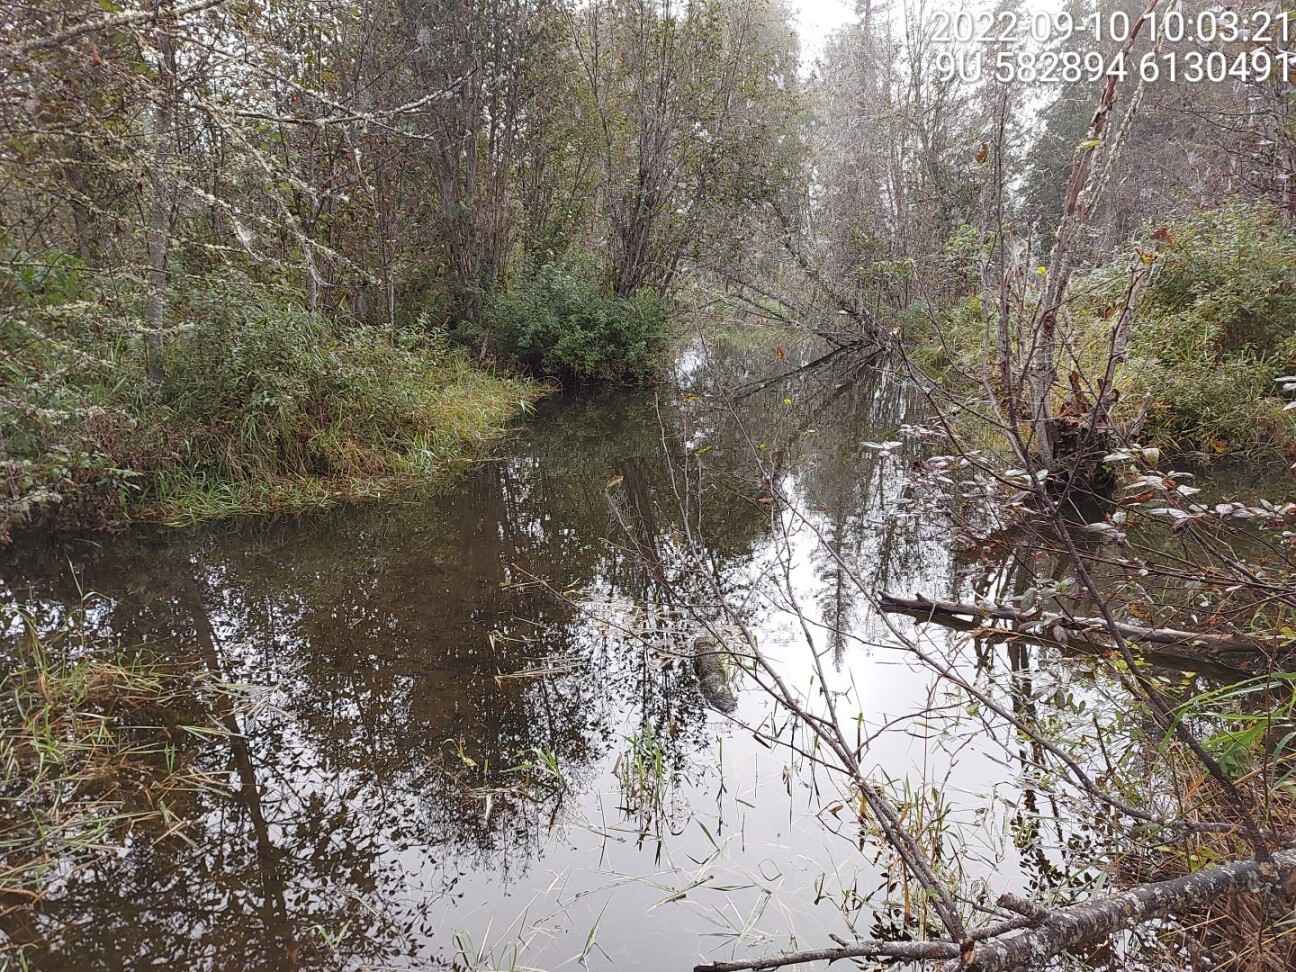
Figure 5.24: Typical habitat downstream of PSCIS crossing 198217.
my_photo2 = fpr::fpr_photo_pull_by_str(site = my_site2, str_to_pull = '_d2_')

my_caption2 = paste0('Typical habitat downstream of PSCIS crossing ', my_site2, '.')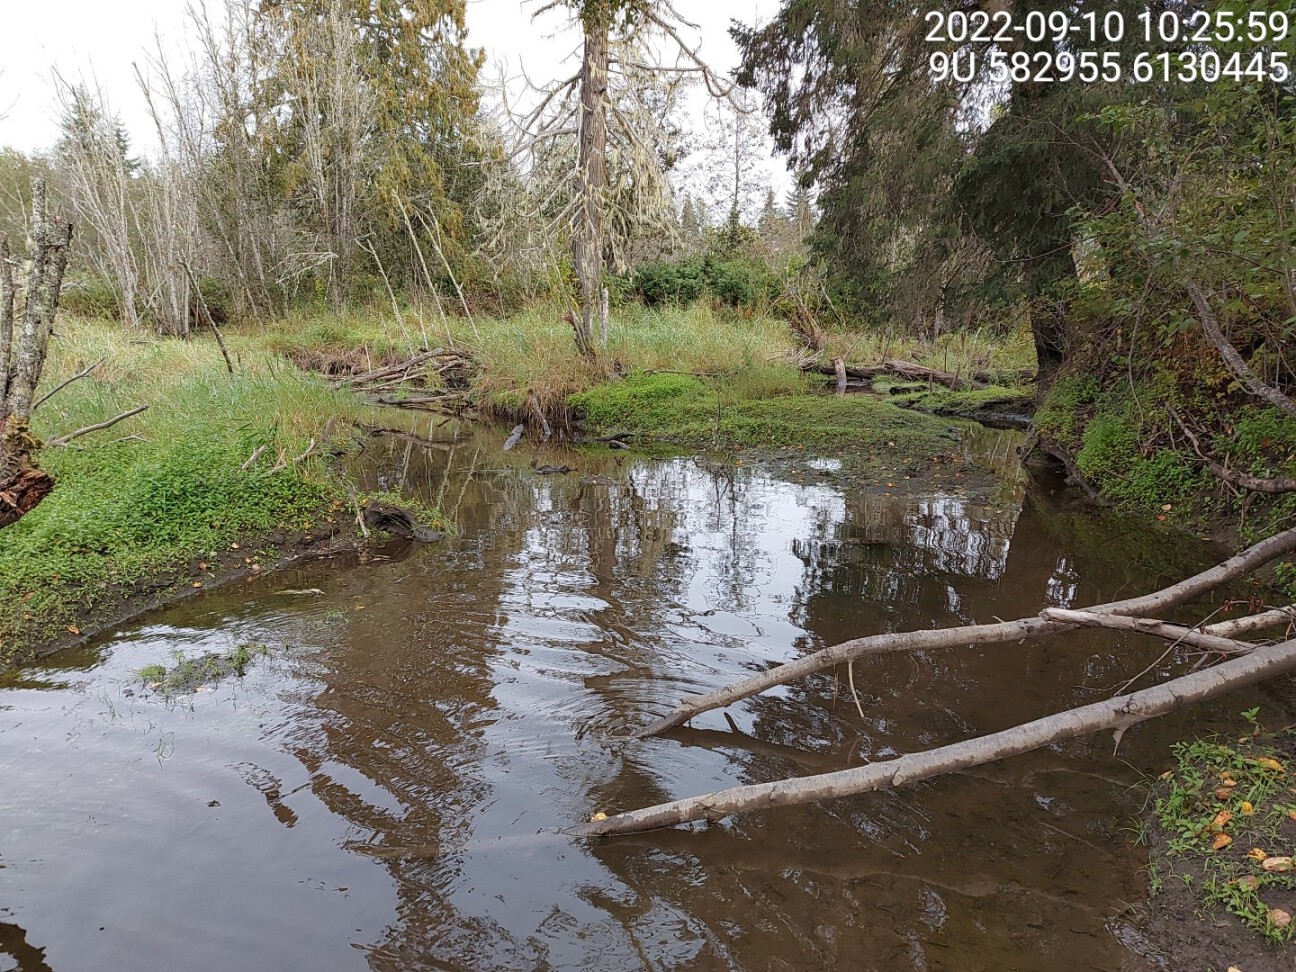
Figure 5.25: Typical habitat downstream of PSCIS crossing 198217.
my_caption <- paste0('Left: ', my_caption1, ' Right: ', my_caption2)

knitr::include_graphics(my_photo1)
knitr::include_graphics("fig/pixel.png")
knitr::include_graphics(my_photo2)
my_photo1 = fpr::fpr_photo_pull_by_str(site = my_site2, str_to_pull = '_u1_')
my_caption1 = paste0('Typical habitat upstream of PSCIS crossing ', my_site2, '.')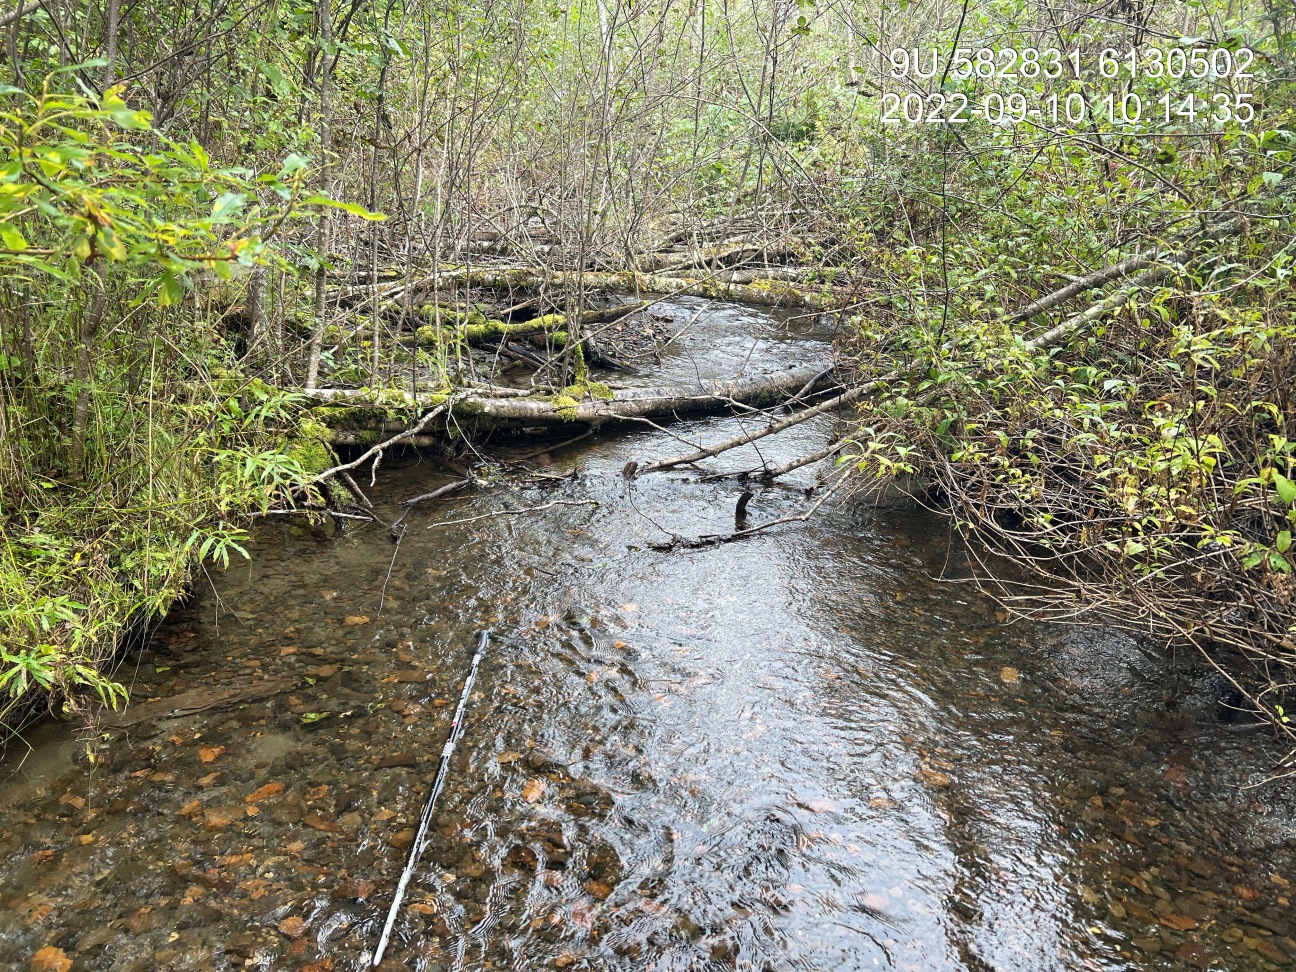
Figure 5.26: Typical habitat upstream of PSCIS crossing 198217.
my_photo2 = fpr::fpr_photo_pull_by_str(site = my_site2, str_to_pull = '_u2_')

my_caption2 = paste0('Typical habitat upstream of PSCIS crossing ', my_site2, '.')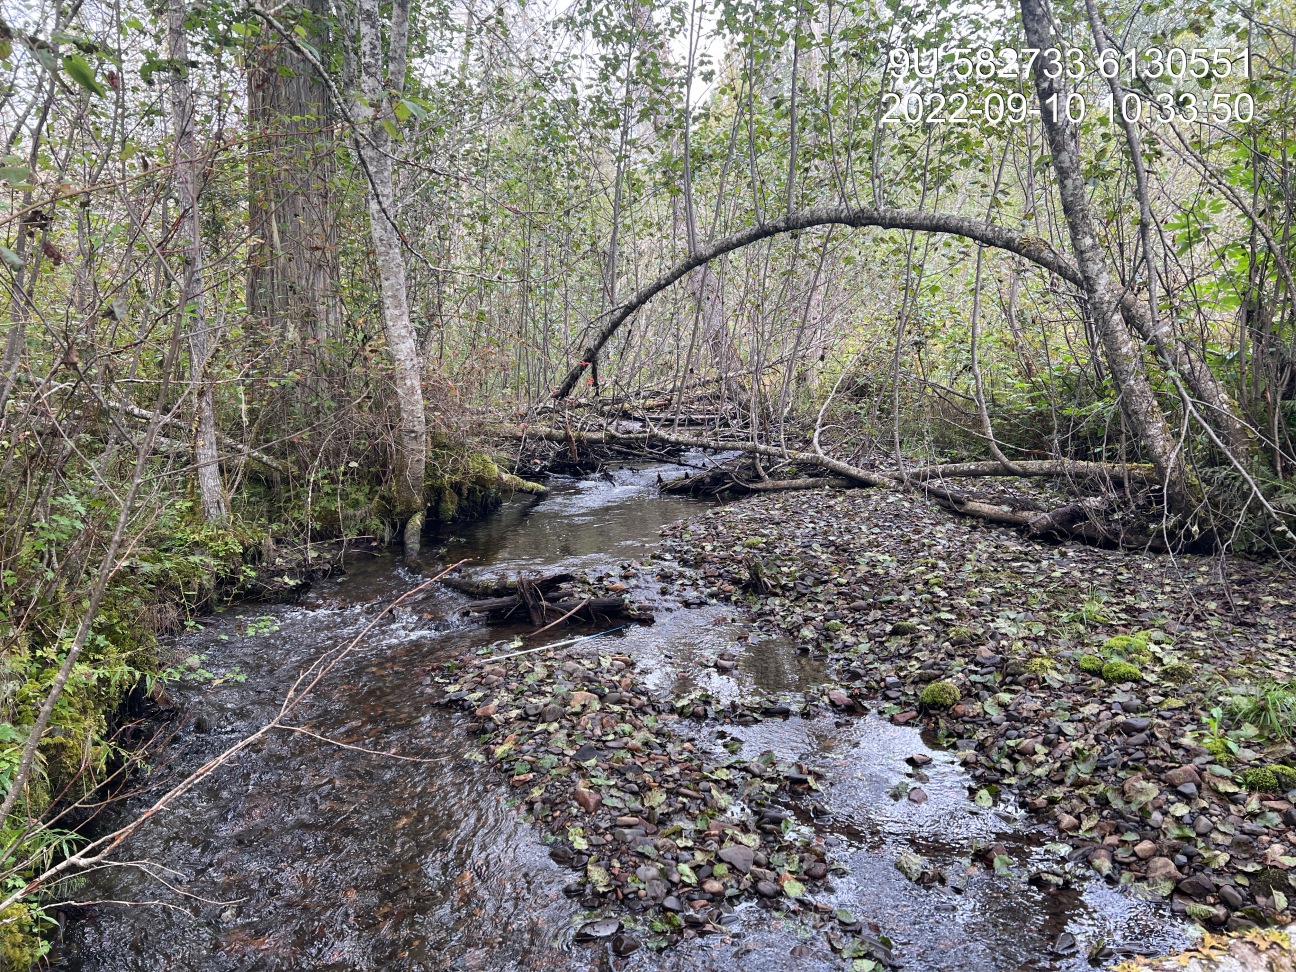
Figure 5.27: Typical habitat upstream of PSCIS crossing 198217.
my_caption <- paste0('Left: ', my_caption1, ' Right: ', my_caption2)

knitr::include_graphics(my_photo1)
knitr::include_graphics("fig/pixel.png")
knitr::include_graphics(my_photo2)
my_photo1 = fpr::fpr_photo_pull_by_str(site = my_site2, str_to_pull = '_u3_')
my_caption1 = paste0('Typical habitat upstream of PSCIS crossing ', my_site2, '.')my_photo2 = fpr::fpr_photo_pull_by_str(site = my_site2, str_to_pull = '_u4_')
my_caption2 = paste0('Typical habitat upstream of PSCIS crossing ', my_site2, ' within smaller southern tributary to the main stream.')my_caption <- paste0('Left: ', my_caption1, ' Right: ', my_caption2)
knitr::include_graphics(my_photo1)
knitr::include_graphics("fig/pixel.png")
knitr::include_graphics(my_photo2)my_photo1 = fpr::fpr_photo_pull_by_str(site = my_site2, dir_photos = "data/photos/", str_to_pull = '_ct_us')
my_caption1 = paste0('Cutthroat trout captured upstream of PSCIS crossing ', my_site2, '.')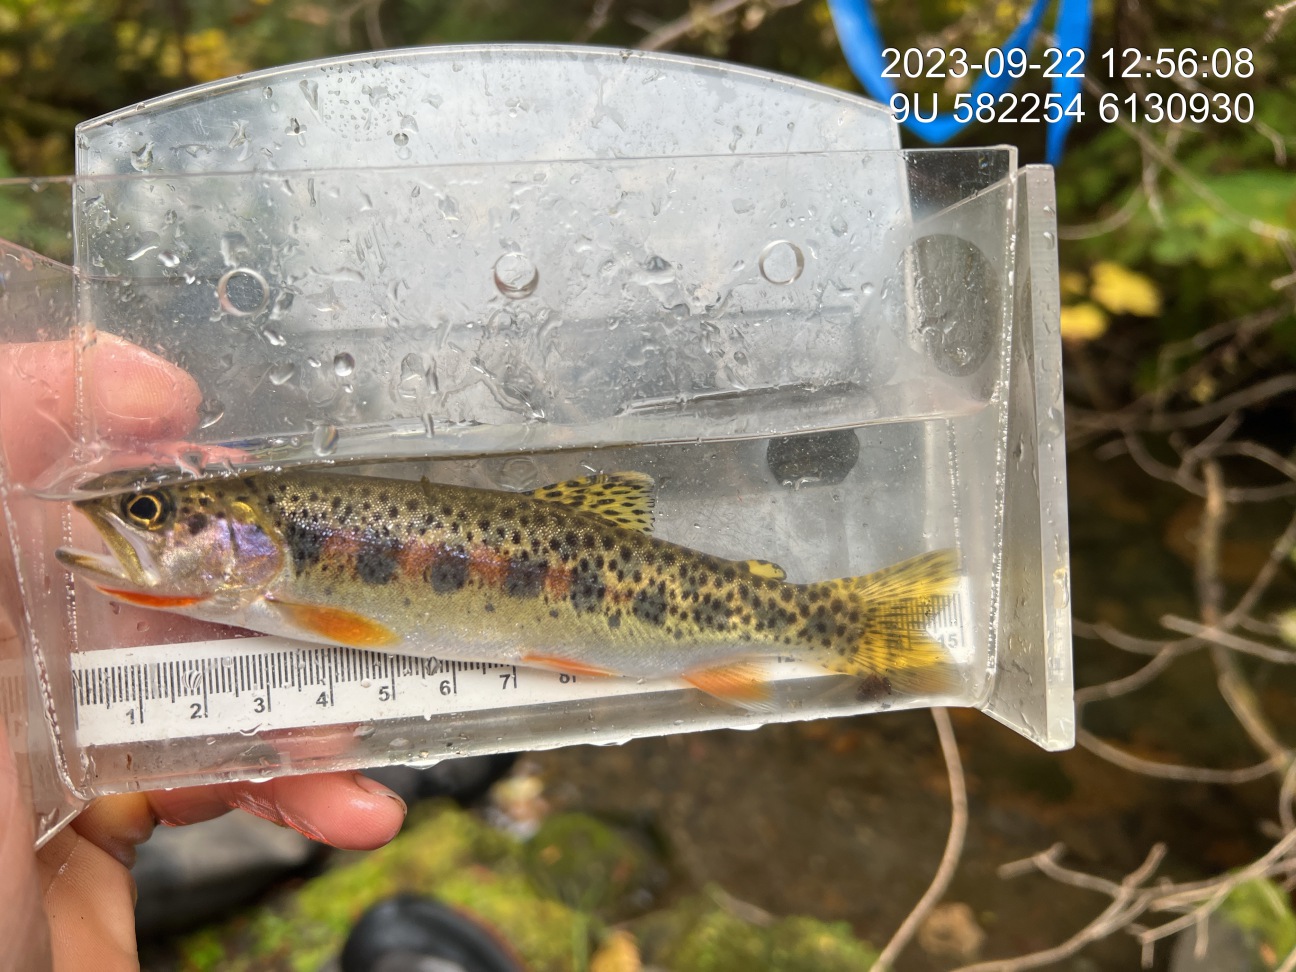
Figure 5.28: Cutthroat trout captured upstream of PSCIS crossing 198217.
my_photo2 = fpr::fpr_photo_pull_by_str(site = my_site2, dir_photos = "data/photos/", str_to_pull = '_dv_ds')
my_caption2 = paste0('Dolly varden captured downstream of PSCIS crossing ', my_site2, '.')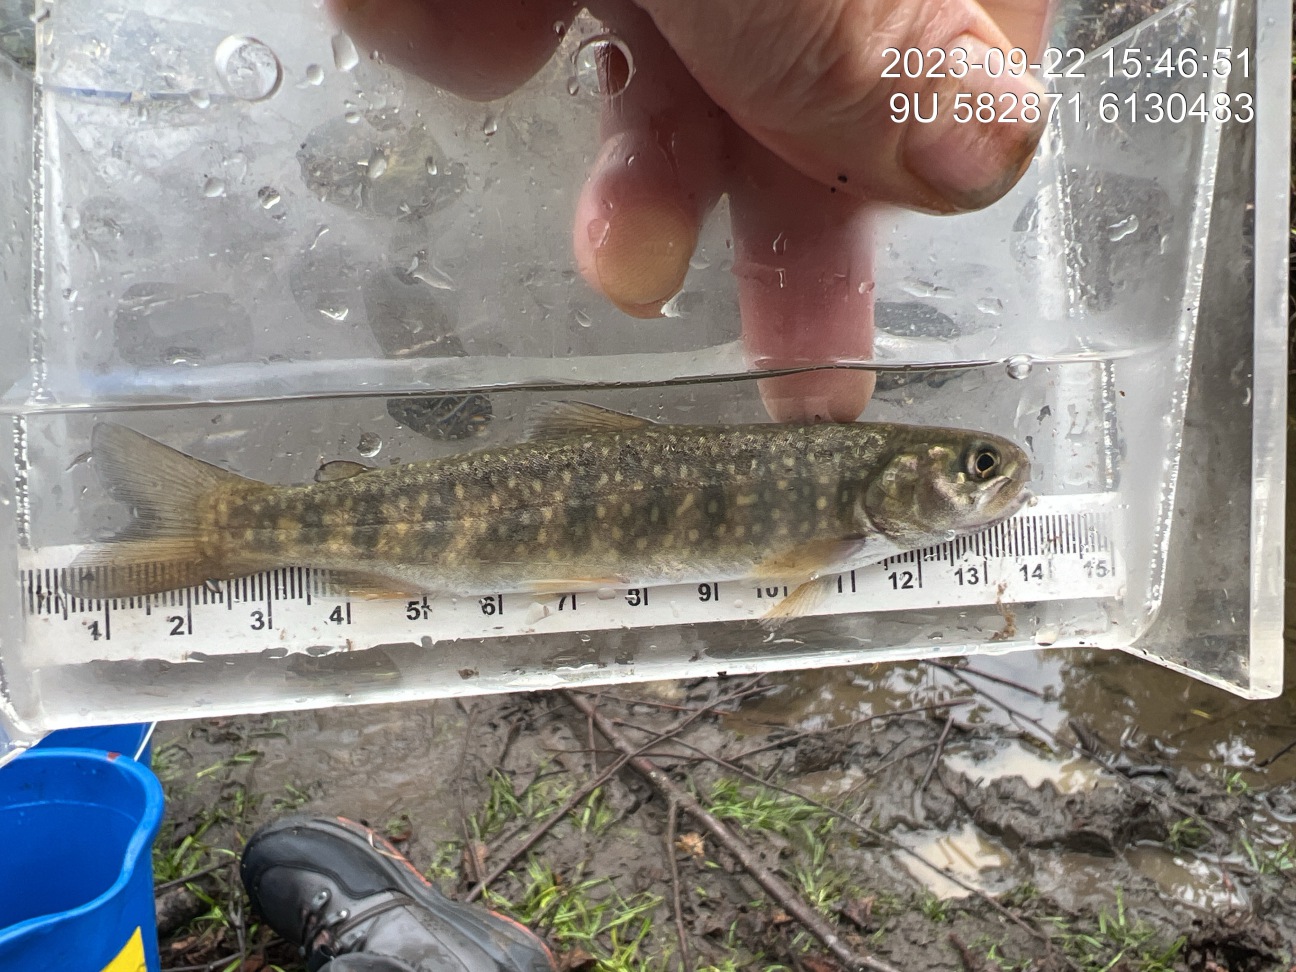
Figure 5.29: Dolly varden captured downstream of PSCIS crossing 198217.
my_caption <- paste0('Left: ', my_caption1, ' Right: ', my_caption2)

knitr::include_graphics(my_photo1)
knitr::include_graphics("fig/pixel.png")
knitr::include_graphics(my_photo2)